Graylog Security Investigations provide a solution for analysts to quickly gather and analyze data in real-time, allowing you to view the full context of an issue or threat without spending hours trawling through logs.
With Graylog Investigations, you can:
-
Create investigations based on timelines, data sets, events, and alerts.
-
Associate events with investigations
-
See associated data points grouped in a single location.
-
Create and reuse investigations to save time and effort.
-
Quickly narrow down results.
-
Collaborate with multiple users on investigations by sharing, assigning, and notifying assignees.
Prerequisites
-
A valid Graylog Security license is required. Contact the Graylog Sales team for more information on purchasing and downloading this license.
How It Works
Investigations are essentially a collection of items within Graylog comprising dashboards, logs, searches, and events (collectively called “evidence”) that are all grouped in one place. You can create a new investigation, update an investigation, and delete or archive investigations.
There are three primary menus on the Investigations page:
-
Open: Displays all open investigations.
-
Archived: Displays all archived investigations.
-
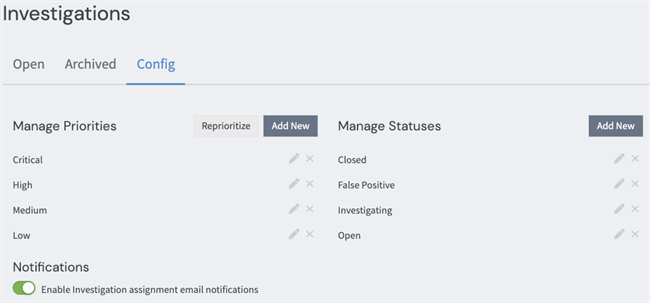
Config: Configuration options for managing priorities and status settings.
Default Priority and Status
On the Config tab, you can designate a default priority and status for new investigations. Hovering to the left of the Edit button on any priority or status will reveal a Set Default button. Clicking this button will designate that priority or status as the default option when creating a new investigation.
Create a New Investigation
The following instructions detail how to manually create a new investigation with Graylog. To automatically generate a new investigation based on an alert from a defined event, see the related documentation.
-
Navigate to Security > Investigations.
-
Select the New Investigation button. A window appears, prompting you to fill out details of a new investigation:
-
Name: Provide a unique name for your new investigation.
-
Assign To: Select other users or teams to which you can assign the new investigation. Alternatively, you can assign an investigation to yourself. (Note that only users with the Admin, Investigations Manager, or Investigations Reader roles are able to be assigned to investigations.)
-
Priority: By default, there are four priority types: Low, Medium, High, and Critical. However, you can edit the priority settings via the Config tab on the Investigations page. You can create new priority types, determine the order in which the priorities should rank, and delete as needed.
-
Status: By default, there are four statuses: Open, Investigating, Closed, and False Positive. You can also edit the status settings via the Config tab on the investigations page. You can create new status types or delete existing ones.
-
Notes: Here, you can collect ideas, thoughts, and notes connected to an investigation to share with others.
-
-
Fill in the details and click Confirm to create a new investigation. The newly created investigation will appear on the Investigations page, and you can start adding evidence to it as you navigate through your data.
Add Evidence to an Investigation
After creating a new investigation, the next step is to add evidence to it. You can add dashboards, logs, saved searches, and events, including events that result from anomaly detection, as evidence entities.
This section details how to add evidence to an investigation manually; however, you may also opt to add evidence to an existing investigation automatically based on an alert created from a defined event. For more information on this process, see Investigations and Alerts.
Saved Searches
You can add saved searches as evidence to investigations directly from the saved search by clicking on the ellipsis icon to the right of the search bar and opting either to add to the active investigation or to another existing investigation.
Dashboards
Dashboards are helpful for visualizing data and understanding trends over time, which can be relevant to any investigation. You can add dashboards as evidence directly from the Dashboards page itself by clicking on the More drop-down action button and selecting either to add to the active investigation or another investigation.
Note that both absolute time ranges and relative time ranges may be displayed in widgets as with saved searches. See the section on relative time ranges for more details.
Logs
Individual logs can often be useful as key pieces of source data for an investigation. Any relevant log can be directly added as evidence by clicking on a search result and from the Investigations sub-menu, selecting either to add to the active investigation or another investigation.
Events
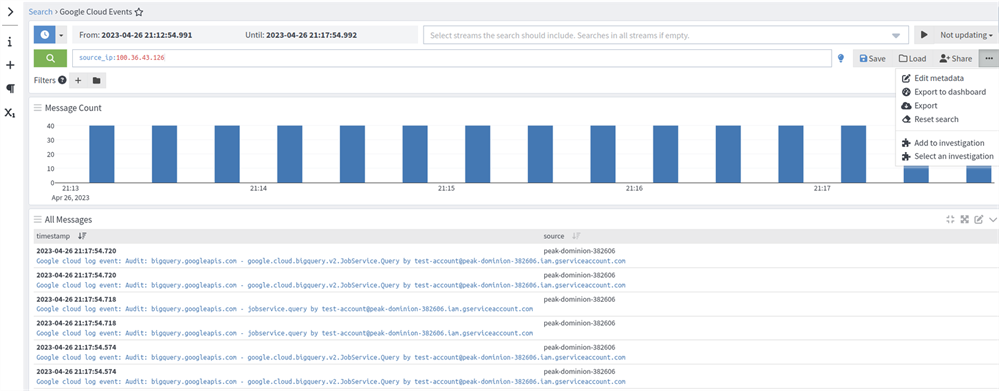
Alerts and events are often the most important pieces of evidence for an investigation. For instance, if an alert for several unsuccessful login attempts is triggered, then you can jump right into an investigation by adding the events as evidence directly from the Alerts & Events tab on the Alerts page.
Select items in the list view, then select Add to investigation from the Bulk actions dropdown. You can add multiple events to an investigation at once. Note that this menu also allows you to replay a search, and replayed searches can also be added to an investigation.
Depending on your index rotation and archiving configuration, older logs and events can be removed from an investigation. In order to ensure pieces of evidence attached to investigations are available even after their source data is gone, we created two streams:
-
All Investigation events: This stream includes all investigation events across all investigations.
-
All Investigation messages: This stream includes all investigation messages across all investigations.
Any log and event evidence added is duplicated in these streams to preserve them.
Associate Assets with Investigations
Associated assets are pulled from log and event evidence when retrieving individual investigations. Those assets are returned with the investigations in an associated_assets field.
Investigate Evidence
After you add evidence to an investigation, review each item to determine whether it represents a legitimate security issue or a false positive. To investigate evidence:
-
From the Investigations page, select an investigation to view its detail page.
-
Review evidence details. Select each evidence item to view its full context.
-
Analyze related data:
-
For events: Review associated details such as timestamp, risk score, and event definition, or replay the search that triggered the event.
-
For log messages: Expand the message to view all fields and interact with the data as you would on the Search page.
-
Other evidence: Use other items, such as saved searches and dashboards, to add context and support for your findings.
-
-
Add investigation notes with your findings, and update the status (Closed, False Positive) if appropriate.
Investigation Sidebar
The investigation sidebar provides persistent access to investigation details while you view related content, such as search results or dashboards. When you perform certain actions, such as Replay Search, the sidebar opens on the right side of the page and remains available as you navigate to other pages.
The sidebar allows you to:
-
Maintain investigation context: Continue viewing and updating investigation details without leaving the current page.
-
Track navigation history: Use the left and right arrows at the top of the sidebar to move backward or forward through previously viewed pages.
Hint: The sidebar maintains history as long as you do not close it with Close sidebar at the top right. Use Collapse sidebar to hide the sidebar temporarily while preserving the history. Select the collapsed sidebar to expand it again.
The sidebar includes the same functionality as the full investigation detail page. You can:
-
Update investigation properties: Set or modify assignment, priority, and status.
-
Add notes: Record findings directly within the investigation.
When you select evidence in the sidebar, such as a dashboard or saved search, the item is displayed in the main window. Event details, however, appear in the sidebar.
View Investigations on a Timeline
The investigations timeline functionality outlines key events and messages that are part of an investigation. It provides a chronological record to track progress and findings. To view investigation details on a timeline, toggle to the Timeline view found on each individual investigation page.
This view helps you visualize and understand the environment of an alert. For example, you can choose to see events that happened during the past week to gain insight into an ongoing investigation. You may widen the timeframe you wish to see, or shorten it to focus on a specific period. To zoom into any evidence in the timeline, click and drag your cursor to mark the period. The timeline range can be reset by clicking on the Reset range button found in the top right corner.
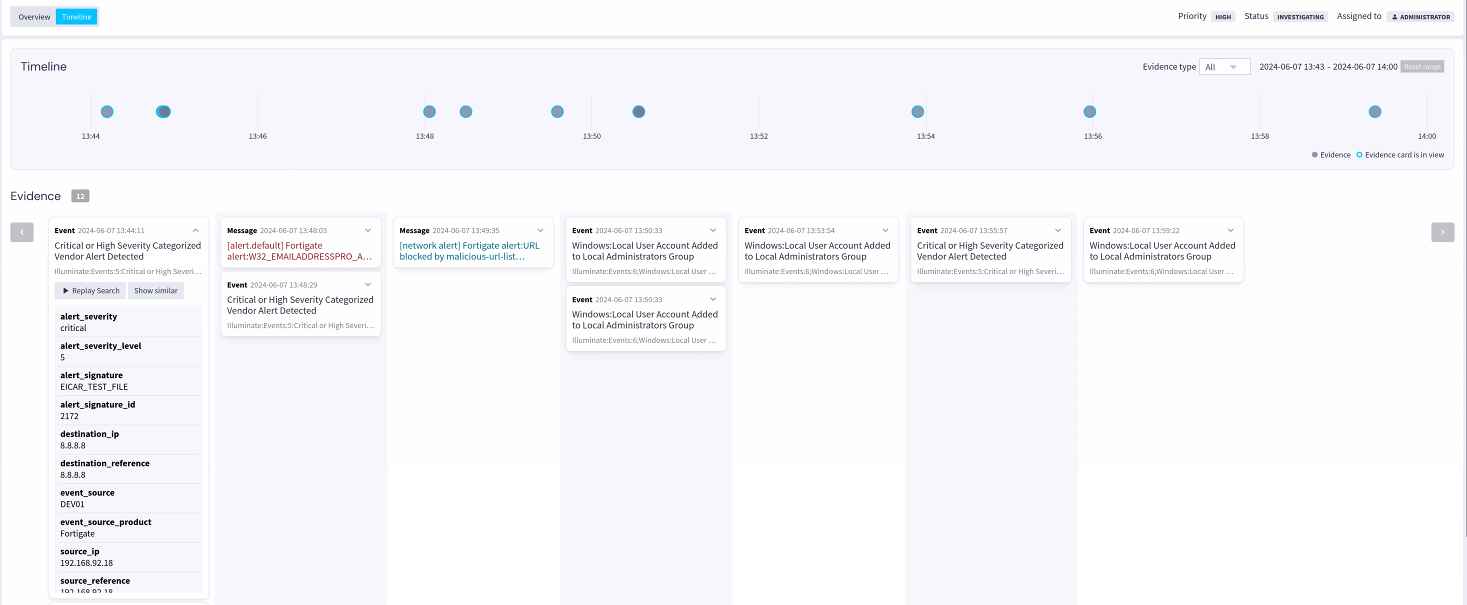
Any messages and events that are related to the investigation are presented in the timeline. Each dot represents an evidence card. When you click on a dot, the related card is highlighted. You can filter the evidence displayed in the timeline to show either messages, events or both. The dots are a darker color when there is more than one piece of evidence that relates to that time period. A highlighted dot means that the Event card is in view.
The evidence cards found below the timeline include details related to log messages and events that are added to an investigation as evidence. Click on the drop down arrow found in the right upper corner of each card to reveal detailed information about the selected piece of data. Details such as message or event field values are displayed in these cards.
The evidence cards offer a Replay Search functionality for events. This provides a view of all messages related to the search. With message evidence cards, you can click Permalink to bring up a detailed message view.
Click Show Similar to display messages and events with similar fields. This filter may be reset by clicking Reset, which is located in the top right corner of the timeline widget.
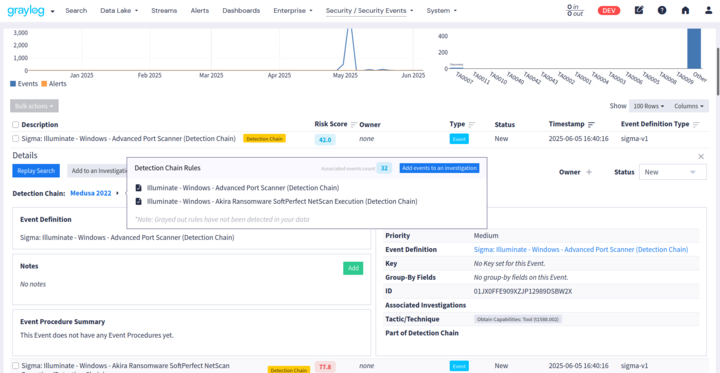
Add Detection Chain Events to an Investigation
As part of Graylog’s integrated threat investigation capabilities, you can add events directly from a detection chain into an active investigation. This makes it easier to correlate related findings, retain relevant context, and accelerate incident triage and response.
By selecting events associated with rules triggered within the detection chain, you can also build an evidence set that reflects the complete sequence of suspicious activity, such as lateral movement, command-line execution, or privilege escalation.
To add an event from a detection chain as evidence to an investigation:
-
Select an event associated with a detection chain (indicated by the detection chain tag).
-
Click on the detection chain title.
-
Click Add events to an investigation (blue button on the right).
-
From the resulting modal window, select an existing investigation or create a new one.
Once added, those events will appear in the associated investigation timeline. You can then correlate them with other artifacts such as event procedures or linked assets.
Assign Investigations
When you have added pieces of evidence to an investigation, you can assign the investigation to other users or teams. Investigations can be assigned at the point of creating a new investigation or subsequently by editing an existing investigation. You may also choose to assign an investigation to yourself via the Assign to drop down menu.
Enable Investigation Assignment Email Alerts
Email alerts can be assigned to investigations. This functionality is enabled by default for existing installations. To disable this setting:
-
Navigate to the Config tab on the Investigations page.
-
Locate the Enable Investigation assignment email notifications capsule button and toggle to disable this setting.
When enabled, email alerts will be sent to both the user and the assigned team(s) involved in the investigation. These alerts are triggered immediately upon assignment.
transport_email_server configuration setting (server.conf) is properly configured to allow your Graylog instance to send emails. If these parameters are not configured properly, the email will not be sent.
Update Investigation Status
Let’s say you have concluded an investigation and you are ready to close the investigation. From your Investigations page:
-
Click on the ellipsis located to the right of the desired investigation.
-
Click Edit.
-
Click on the ellipses found to the right of the investigation's title.
-
Click Edit.
-
Select Closed to update the status selection in the modal.
This ends an open investigation. However, closed investigations are still editable and can be assigned to users or teams.
To fully close an investigation, making the investigation inaccessible, you must archive the investigation:
-
Click the vertical ellipsis to the right of the selected investigation.
-
From the resulting drop-down menu options, choose Archive.
This action removes the investigation from the Open tab to the Archived tab. At this point you cannot make any edits to the archived investigation.
If an investigation was archived in error:
-
Click the ellipsis to the right of an investigation in the Archived tab.
-
Select Restore.
You can also bulk restore archived investigations by selecting the check boxes for the archived investigations from the Archived tab. Then click the Bulk Actions button drop-down, and select Restore. This restores the archived investigations into the Open tab.
Perform Bulk Actions
You can perform bulk archiving, assigning, and deleting tasks in the Investigations menu.
To perform bulk actions, navigate to the Investigations page, select the investigations by clicking on the checkbox, and click the Bulk Actions drop-down to assign, archive, or delete multiple investigations.
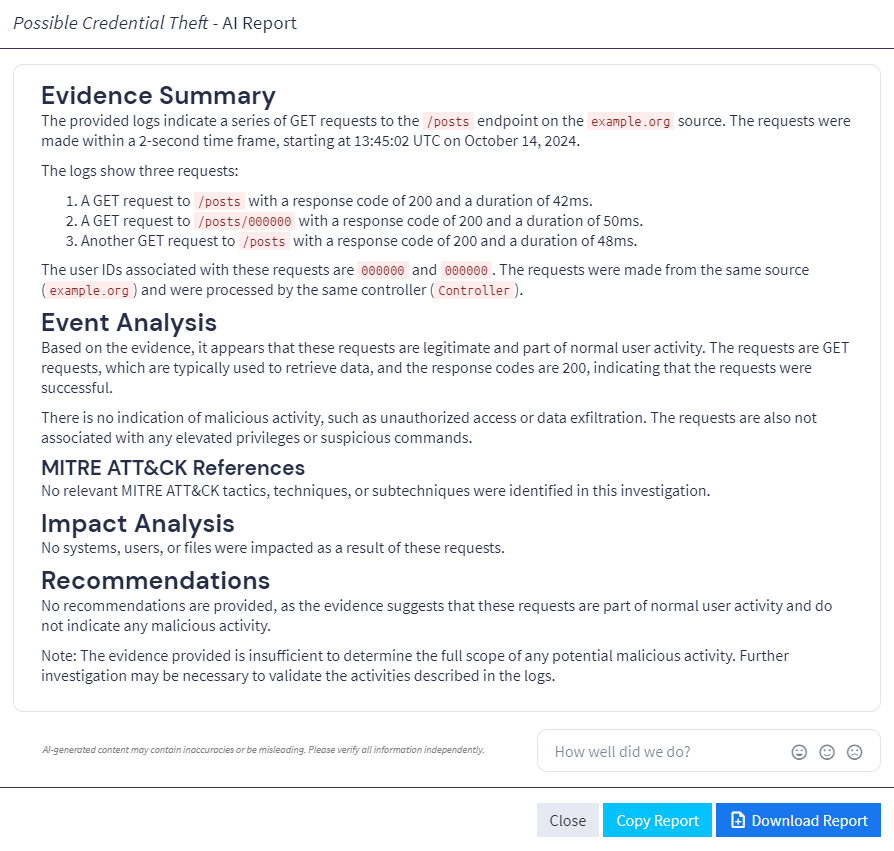
Compose Investigation Report by AI
Investigations include an AI-powered reporting feature that analyzes submitted events and logs to generate a detailed report, including key findings and recommended defensive actions. For the AI-generated report to be produced, the investigation must contain at least three logs, and your Graylog environment must have access to the public internet.
To create a new AI report:
-
Navigate to Security > Investigations.
-
Locate the investigation you wish to summarize and click AI Report. (Note that this button will only be available if you have met the minimum requirement of three attached logs to the investigation.) If this is the first report you have generated, you will be prompted to review the Terms and Conditions for this feature.
-
Review this disclaimer carefully and determine if you wish to use the feature as indicated.
-
Once you proceed the investigation report will appear in the resultant window for your review. You may then copy the text of the report by selecting Copy Report or download a text file of the report by selecting Download Report.
Roles
Graylog includes two roles in user permissions related to investigations:
-
Investigations Manager: With this role, you have full control over investigations.
-
Investigations Reader: With this role, you have read access to investigations only.
Determine Relative Time Or Absolute Time Ranges
Often searches are conducted using a relative time line, such as "everything from the last hour." Considering this, when you decide to include a saved search as evidence to an investigation, Graylog will now prompt you to either convert the logged times to absolute time or maintain the relative search. Opting to convert to relative time will result in the system duplicating your saved search, preserving the absolute time parameters, and labeling the saved search as Absolute Time. This allows you to utilize either search as necessary.
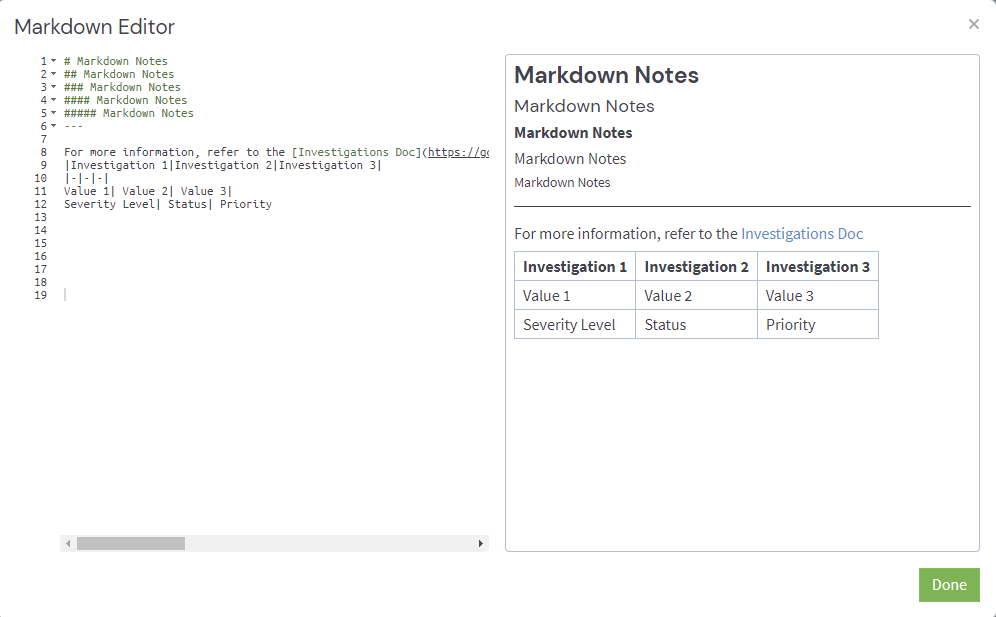
Use Markdown in Investigation Notes
Investigation notes have a custom markdown editor. The custom markdown editor significantly enhances the note-taking experience by allowing you to structure and format your notes using features such as headers, bullet points, tables, numbered lists, code snippets, and hyperlinks.
The markdown editor preview feature enables you to view the final output, allowing you to rectify errors and discrepancies before saving.