A dashboard is a customizable visual that displays real-time or historical data from log sources, allowing you to monitor, analyze, and visualize key metrics in one centralized location. Dashboards are made up of widgets, which can display aggregated data in various formats, such as charts, graphs, or single-value metrics or disaggregated data in the form of log message tables. For details about creating widgets, see Widgets.
You can customize dashboards to fit your use case. For example, you might create dashboards for any of the following purposes:
-
System Health and Performance: Monitor performance metrics (CPU load, memory, response times) to maintain system health and address issues quickly.
-
Log Aggregation and Analysis: Consolidate and analyze logs from various sources for troubleshooting and compliance.
-
Compliance Reporting: Display compliance-relevant log data for easier audit trails and adherence to standards.
-
User Behavior Tracking: Monitor access logs and activity patterns to spot unauthorized access or unusual behavior.
-
Custom Metrics for Management: Display critical metrics like uptime and service health, offering a high-level system overview for managers.
Graylog also provides a number of pre-built dashboards. For example, Graylog Illuminate content packs include dashboards tailored to specific log sources and security use cases. Additionally, Graylog Security provides pre-configured, interactive dashboards designed to help security teams monitor, detect, and respond to security incidents.
You can also share dashboards with key stakeholders. See the Share Dashboards section for more information.
This article guides you through the process of creating new dashboards and customizing them to your use case. Additionally, we cover how to build dashboards with automatically updating information, which can be shared with any authorized user or user group.
Dashboards vs Saved Searches
While dashboards and saved searches are both ways to preserve and show subsets of data, they serve fundamentally different purposes. Dashboards are visual indicators used to monitor and present data at a glance. A saved search allows you to save specific search queries, including any filters, time ranges, and parameters you have configured, so you can easily access and run these searches again at a later time.
However, you can define specific search criteria for log data displayed in a widget. See the widget search criteria section of the widgets documentation for more information.
Create a New Dashboard
Complete the following actions to create a new custom dashboard:
- Select the Dashboards tab in the top-level menu. This page lists all dashboards that you are permitted to view.
- Select Create new dashboard to create a new, empty dashboard.
- Select Save as.
- Enter descriptive information for the new dashboard in the dialog box. Note that Title is the only required field. Use a brief and unique title so other users can easily understand what to expect from the dashboard. The description can be longer and can contain more detailed information about the displayed data or how it is collected.
- (Optional) Enter any collaboration and sharing options. For information about adding collaborators and sharing when creating a dashbaord, see Share a New Entity. For information about sharing an existing dashboard, see Share Dashboards.
- Select Create dashboard.
Now you can add widgets to your newly created dashboard! See Widgets for more information on creating and adding widgets to dashboards.
View Advanced Field Types
Advanced field types, such as nodes, streams, and inputs, are displayed in dashboards by readable titles rather than their IDs. The search is performed using the id parameter, but the default display is by title, allowing you to analyze your search results more clearly. For more about field type management, see Field Types.
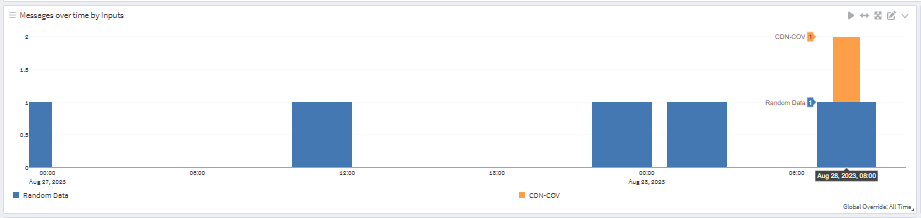
Note that the numerical ID is still visible if you hover over a title in the search results. In addition, when writing or editing a query, both title and ID are shown for reference.
title parameter, the change is applied to all dashboards.
Export a Search as a Dashboard
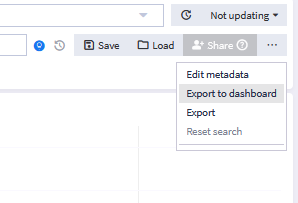
The previous sections describe how to create a dashboard from the Dashboards menu, but you can also move an existing search to a dashboard. Click on the three dots on the right side of the search bar and select the Export to dashboard option. The newly created dashboard is a draft. You will need to click on the Save as button, found in the top right corner of the draft page, to create the dashboard permanently.
Share Dashboards
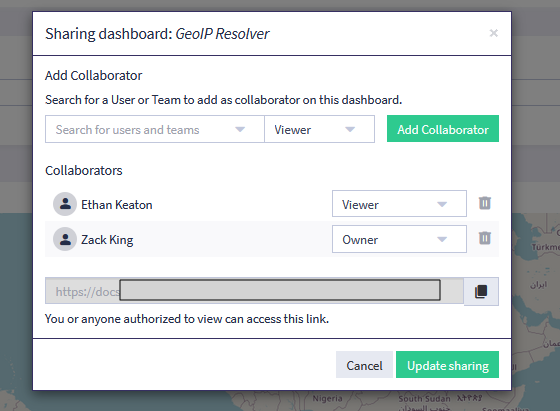
Anyone with the Admin role can view and edit dashboards. The Reader role cannot view or edit any dashboards by default. An administrator can share a dashboard with a specific user or team:
-
Navigate to Dashboards.
-
Find the dashboard you want to make available to other users, then click Share.
-
Select users or teams from the drop-down menu.
-
Select the access level the user should receive:
-
Viewer: Can view the entity but not make any changes to it. -
Manager: Can edit any aspect of the entity. For some entities, this access level allows the user to delete the entity. -
Owner: Has the same permissions asManagerbut adds the ability to share the entity with other users.
-
- Click Add Collaborator.
-
Review your selection and click Update sharing.
You can also share dashboards by using collections, which allow you to include multiple entities together in a single share. To add a dashboard to a collection:
-
Navigate to Dashboards.
-
Find the dashboard you want to add to a collection, then select Manage collection on the More menu in the Actions column.
-
Enter a search term or scroll the list to find a collection to add. Note that you can add multiple collections in this field.
-
Click Save.
When you share a collection, all entities in the collection are shared. See Collections for complete details.
Review Permissions Management for a full list of permissions available to users and teams in Graylog.
Dashboard Use Case
Sally is a system administrator who wants to build a dashboard for her company. She wants to add aggregation widgets that display information about the company log sources and an internal application named Zirva. She aims to have a dashboard that she can show her organizations stakeholders so that they have better real-time information regarding the company system. After creating and saving the new dashboard, she decides to add several widgets to it. See the steps she takes below for each widget:
-
Sally wants to find and display the log sources that most frequently appear in the company system. She will:
- Enter
*as the search query and set the time frame to 1 day using the time-range selector. - Click the Create (+) button and select Aggregation.
- Click Edit to configure the widget.
- Select
Data Tableas the visualization type: - Group by Row and select
sourceas the Field. - Add
countas the function andsourceas the field under Metrics. - Select
count(source)under Source. - Click Preview widget to view the outcome.
- Click Update widget to save the widget to the dashboard.
- Enter
-
Sally wants to find the number of exceptions in the application Zirva, over the period of one day. She will:
- Enter
source:Zirva AND Exceptionas the search query and set the time frame as last 24 hours. - Click the Create (+) button and select Aggregation.
- Click Edit to configure the widget.
- Set Visualization to
Single Number - Set Metric to
count(). - Click Update widget to save it to the dashboard.
- Enter
-
Sally wants to create a response time chart for Zirva. She will:
- Enter
source:Zirvaas the search query and select a time frame. - Click the Create (+) button and select Aggregation.
- Click Edit to configure the widget.
- Set Visualization to
Single Number. - Set Metric to
avg(response_time). - Click Update widget to save it to the dashboard.
- Enter
Sally now has a comprehensive dashboard that displays data relevant to the new company application.