Alerts are notifications that you can set up to inform you about an event. They can be created via the Create Notification selection on the Notifications page under Alerts or can be defined in the event definition workflow.
In this section, we explain how to create an alert and how to configure supported alert types.
Prerequisites
The following prerequisites are required before utilizing alerts with Graylog:
-
Alerts are triggered by defined events, therefore an event definition is required.
-
Graylog Enterprise is required for script and PagerDuty alerts.
Alerts can be created by selecting Notifications under the Alerts menu or by defining them in the event workflow.
Alerts and Events Page
The Alerts & Events page in Graylog is the central hub for monitoring, triaging, and responding to system notifications in real time. It gives you visibility into system behaviors, warning conditions, and failures as they occur across your environment. The page is organized into three core sections:
Search and Filters Panel
At the top of the page, a search bar lets you find events using keywords, while the Filters dropdown allows you to drill down further into specific events or alerts.
Clicking the + button next to Filters opens a dropdown where you can filter by:
| Filter Option | Purpose |
|---|---|
|
Associated Assets |
Filter by assets linked to the event. |
|
Associated Investigations |
Filter by events tied to an ongoing investigation.
|
|
Event Definition |
Filter by the predefined rule that triggered the event. |
|
Event Definition Type |
Filter by the category of the event definition. |
|
Owner |
Filter by the user or entity assigned to the event. |
|
Priority |
Filter by severity level (Critical, High, Medium, Low, Info). |
|
Risk Score |
Filter by the calculated risk score of the event. |
|
Status |
Filter by the current state of the event (e.g., New, Closed, Investigating). |
|
Tactic/Technique |
Filter by security framework classifications. |
|
Timestamp |
Filter by the date/time range when the event occurred. |
|
Type |
Filters by event type (Event or Alert). |
Active filters appear as removable tags and can be combined for refined queries.
Metrics Graph Widget
A visual chart that plots the count of events over time, helping you quickly spot spikes or trends. It features an interactive timeline (hover for event counts at specific times) and an auto-refresh toggle to switch to real-time monitoring.
-
Blue Line (Events): Events are color-coded to blue and represent detected events.
-
Orange Line (Alerts): Alerts are color-coded to orange and highlights triggered alerts.
-
Interactive Axis: Hover over graph points for a summary of event counts at specific times. X-axis represents a timeline, and the Y-axis represents count.
-
Export: The chart can be exported using the download icon for reporting purposes.
-
Auto-refresh: Set the refresh behavior by clicking the clock icon for auto-refresh or the Not updating dropdownto choosing a timeframe ( e.g. 5 seconds, 10 seconds, 1 minute or 5 minutes).
This widget is instrumental in identifying spikes in malicious behavior or assessing alert volumes over time.
If the message “No events have been found” is displayed, it means no event definition rules have triggered within the selected filters or timeframe. You may need to:
-
Expand the timestamp range.
-
Remove filters.
-
Confirm event generation on the backend is functioning.
Beneath the metrics graph, all your alerts and events are listed in a table, grouped into various filterable columns. Additional columns can be displayed or removed by clicking on the Columns dropdown button and selecting available column categories.
From the list of all displayed alerts and events, you can click to expand and view its details or you can click the Details button in the Actions column. You can also click the Bulk actions dropdown for a list of available actions applicable to selected alerts or events.
Notifications Page
After you create alerts, they are displayed on the Notifications page. You can edit or delete existing notifications. This page also includes bulk actions. You can see if your alerts are active by selecting Test Notifications under More. A success or error message displays under the entity title.
You can also add collaborators to existing alerts by selecting Share. You can add the alert to a collection by selecting More > Manage collections, then choosing the collections the entity should be added to.
Alerts Page Example
You can troubleshoot failed inputs by filtering. For instance, an event like INPUT_FAILING: An input has failed to start is a critical system warning which surfaces in the alerts and events page. Filtering by Type = Event, Event Definition = System notificationevents and Priority = Low/High quickly isolates these kinds of events for response or escalation.
Create an Alert from the Alerts Menu
-
Navigate to the Alerts menu and select Notifications.
-
Select Create notification.
-
Complete the following fields:
Title
Create a unique title for your alert.
Description (optional)
Add additional details about your alert if desired.
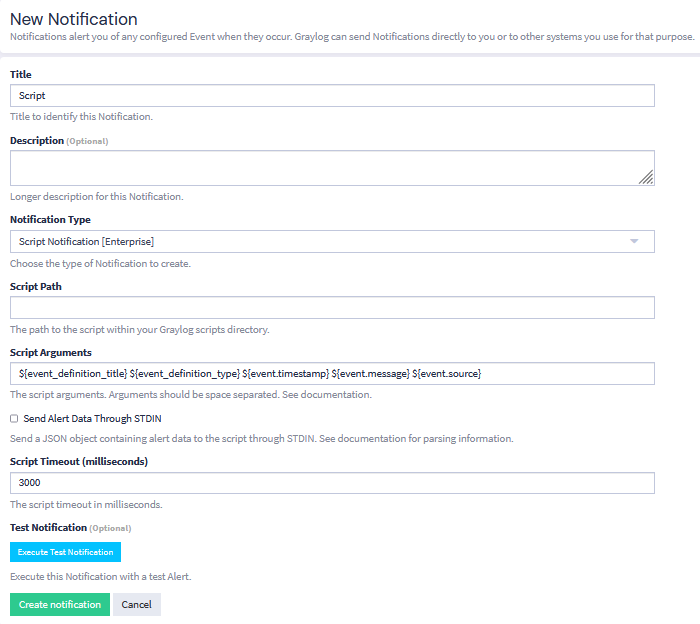
Notification Type
Select the alert type from the dropdown.
-
Enter alert type details. When you select your Notification Type, additional fields based on the type appear. The alert types and key fields to configure for each are detailed in Alert Types.
-
(Optional) You can test your alert at this time by selecting Execute Test Notification. If required information is missing or incorrect, this test shows which fields need to be corrected.
-
(Optional) Enter any collaboration and sharing options. For details about adding collaborators and sharing, see Share a New Entity.
-
Click Create notification.
Create an Alert in the Event Definition Workflow
You can choose to create an alert while defining a new event.
-
In the New Event Definition workflow, select the Notifications tab.
-
Select Add notification, then select Create New Notification from the dropdown.
-
Complete the following fields:
Title
Create a unique title for your alert.
Description (optional)
Add additional details about your alert if desired.
Notification Type
Select the alert type from the dropdown.
-
Enter alert type details. When you select your Notification Type, additional fields based on the type appear. The alert types and key fields to configure for each are detailed in Alert Types.
-
(Optional) You can test your alert at this time by selecting Execute Test Notification. If required information is missing or incorrect, this test shows which fields need to be corrected.
-
(Optional) Enter any collaboration and sharing options. For details about adding collaborators and sharing, see Share a New Entity.
-
Click Add notification. Then, complete your event definition.
Metadata Available to Alerts
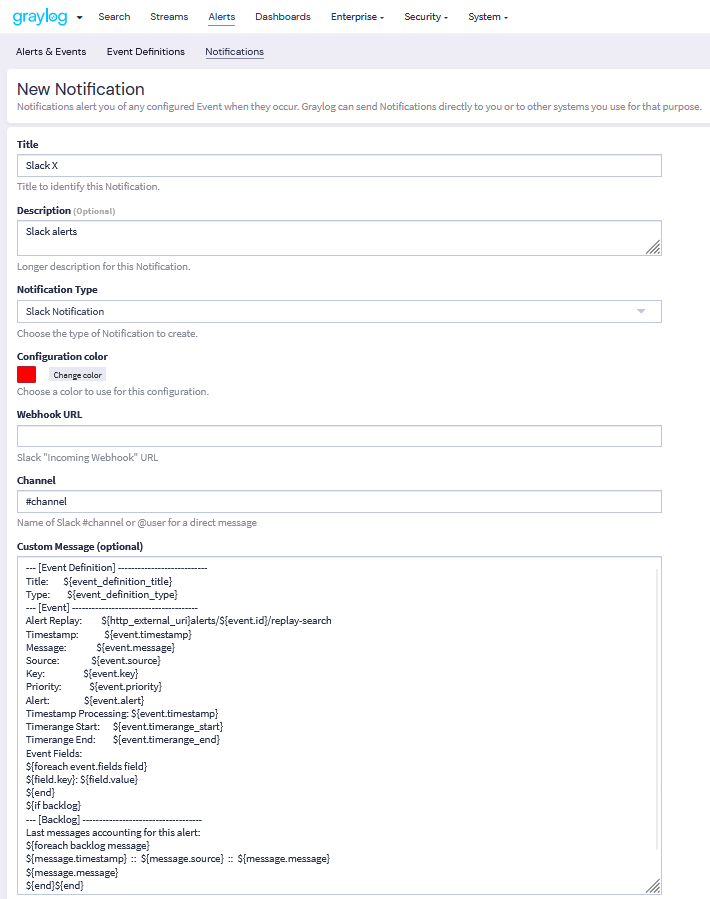
When creating alerts you can utilize metadata from the event definition, the event itself, and the event's backlog messages (if it is configured to retain a backlog). This metadata can be used when formatting email, Slack, and Microsoft Teams alerts or when providing arguments to a script alert.
For example, if you wish to include more information in your Slack alerts, you may add new fields to the Custom Message section. You may also remove any fields that you do not wish to see by deleting them from this section.
Or you could add arguments to a script alert to include more information in your alerts.
Fields that are available for each entity type are detailed below.
Event Definition Metadata
| Field | Type | Description |
|---|---|---|
|
String |
The database ID of the event definition |
event_definition_type
|
String |
The internal name of the event definition type (correlation-v1) |
event_definition_title
|
String |
The title set in the UI |
event_definition_description
|
String |
The description set in the UI |
|
String |
The internal job definition ID associated with a scheduled event definition |
job_trigger_id
|
String |
The internal ID associated with the current execution of the job. |
Event Metadata
| Field | Type | Description |
|---|---|---|
|
|
The event as it is stored in Graylog |
|
|
String |
The message ID of the stored event |
|
|
String |
The database ID of the event definition |
|
|
String |
The internal name of the event definition type ( |
|
|
String |
URN of the message or event creating this event (either |
|
|
DateTime |
The timestamp can be set to the underlying event or message (see |
|
|
DateTime |
The timestamp for when the event was created by Graylog |
|
|
DateTime |
The start of the window of data Graylog used to create this event (can be empty) |
|
|
DateTime |
The end of the window of data Graylog used to create this event (can be empty) |
|
|
String |
The list of stream IDs the event is stored in |
|
|
String |
The list of stream IDs the event pulled data from |
|
|
Boolean |
Whether this event is considered to be an alert; always |
|
|
String |
A human-friendly message describing this event |
|
|
String |
The host name of the Graylog server that created this event |
|
|
String |
The list of values making up the event’s key |
|
|
String |
The event’s key as a single string |
|
|
Long |
The event’s priority value |
|
|
Map |
The custom fields attached to the event |
Backlog Metadata
| Field | Type | Description |
|---|---|---|
|
|
The list of messages or events which lead to the alert being generated |
|
|
String |
The message ID |
|
|
String |
The name of the index the message is stored in; use together with |
|
|
String |
The |
|
|
String |
The |
|
|
DateTime |
The |
|
|
String |
The |
|
|
Map |
The remaining fields of the message (can be iterated) |
Aggregation Result Fields
When an event is generated from an aggregation-based event definition, Graylog dynamically adds fields that represent the results of the configured aggregation functions. These fields are not fixed and depend entirely on how the aggregation is defined.
Field Naming Convention
Aggregation result fields are stored under the aggregation_conditions object using the following format:
aggregation_conditions.<function>_<field_name>Examples:
-
aggregation_conditions.count
-
aggregation_conditions.avg_destination_bytes_sent
Each field corresponds to a specific aggregation function applied during event evaluation.
Field Types
All aggregation result fields are stored as numeric values:
Type: Double (for average, min, max, or other calculated values, depending on implementation)
These values represent the computed result of the aggregation at the time the event is triggered.
How Aggregation Fields Are Generated
Aggregation result fields are created dynamically based on the aggregation conditions defined in the event:
-
Each aggregation condition produces a corresponding field.
-
Field names reflect both the aggregation function and the target field.
-
Fields are only present if the aggregation condition is evaluated during event execution.
For example, if an event definition includes the following aggregation conditions:
-
count()
-
avg(destination_bytes_sent)
The resulting event will include:
-
aggregation_conditions.count
-
aggregation_conditions.avg_destination_bytes_sent
Example:
Given an event definition that monitors unusual outbound traffic:
Function: avg(destination_bytes_sent)
An example event may include:
aggregation_conditions.avg_destination_bytes_sent: 15432Delete Queued Alerts
If processing stops and event updates begin to pile up in the queue, then you might have unknowingly fired too many alerts. To avoid an influx of alerts, make sure to set an alert grace period for event definitions. The grace period enforces a rate limit on how many alerts are triggered for identical events. This effectively prevents queued event alerts. Without a grace period in place, too many event triggers can cause a backlog of alerts.
If you are faced with queued event alerts, there are two ways of clearing the alert queue.
Clear Alert Queue Manually
Clear the alert queue manually through the interface:
-
Navigate to the Events Definition menu by selecting Alerts > Event Definitions.
-
From the list of definitions available, click on the Information icon under Scheduling.
-
The event definition menu will expand. Here, you will see the number of queued alerts. If there are a lot of queued alerts, this typically suggests an abnormality. On the Queued alerts line, click on clear to clear queued alerts for the selected event definition.
Disable an Event
You can also clear the alert queue by disabling an event.
-
As in the previous example, navigate to the Events Definitions tab.
-
Next to your event definition, click the More drop-down button, and select Disable from the menu option for the event you wish to disable.
-
Upon selecting the Disable option, a pop-up dialog screen appears, prompting you to confirm the selection.
-
When disabled an alert is displayed confirming that the selected event definition has been disabled.