Health Module
The Health Module is a built-in health check system that monitors the health of your Graylog deployment and presents the results in a hierarchical health tree. The health tree has three branches, each reporting on the status of its cluster subsystems.
This article explains how the Health Module is organized, how status is calculated, and how to use it to find and resolve issues in your cluster.
Prerequisites
Before proceeding, ensure that the following prerequisites are met:
-
You are a Graylog administrator with permission to view System > Overview. The health tree and health status badges are visible only to users with this permission.
How It Works
The Health Module is located at System > Overview > Health. In the left pane, Cluster Health sits at the top of the health tree, and below it are three branches, one for each major cluster component.
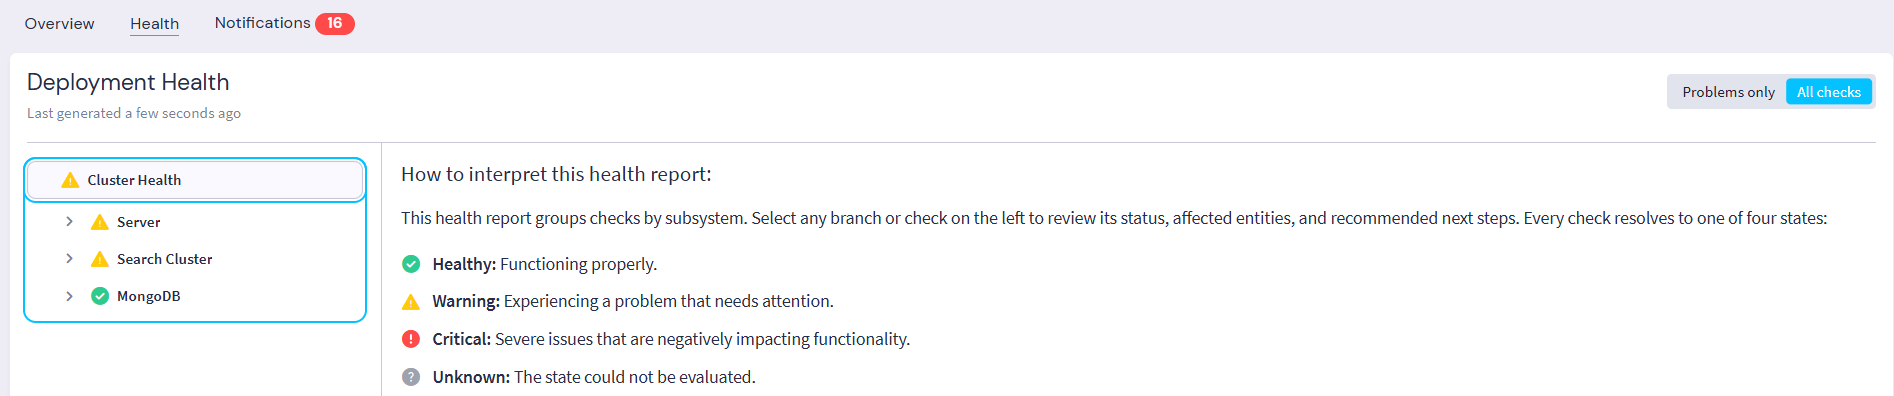
Each branch splits into subsystems, such as Input and Output. Each subsystem surfaces individual checks, such as Input Failures, Report Generation, or Shard Count.
The following list walks through the health tree from the top down, starting with Cluster Health and then each branch and its subsystems.
-
Cluster Health: This is the top node of the health tree. It doesn't run checks of its own; instead, it summarizes the status of the three branches, as described in How Status Is Calculated. Selecting Cluster Health opens the How to interpret this health report information pane, which summarizes how the health checks are organized and defines each status.
-
Server: This branch covers the Graylog Server message processing pipeline. Its checks are grouped into six subsystems. Node watches each Graylog node's resources and whether message processing is running. Input, Processing, and Output follow messages through the pipeline, watching buffer queues, failing inputs, the on-disk message journal, indexing lag between nodes, and scheduled report delivery. Archiving watches for failed archive jobs, and Data Lake watches whether the Data Lake backend is reachable and whether messages are being dropped.
-
Search Cluster: This branch covers your search backend, where messages are stored and searched. Its checks are grouped into two subsystems. Server watches the overall cluster state, each node's resources, TLS certificate expiry, and quorum. A cluster with exactly two cluster-manager-eligible nodes is flagged because it can't reliably elect a cluster manager if one node goes down. Index Management watches warm-tier snapshot moves and whether any hot data node holds too many shards for its available heap.
Hint: Some health checks need data that's available only from a Graylog-managed OpenSearch cluster, so they report Unknown when the search cluster is externally managed or runs Elasticsearch 7.
-
MongoDB: This branch covers the configuration database. Unlike the other branches, it has no subsystems; its four checks sit directly under the branch. Connectivity watches whether Graylog can reach MongoDB, and Primary State watches whether the replica set has an elected primary. A standalone MongoDB deployment always reports Healthy for this check. Slow Queries watches for queries that take longer than 100 milliseconds, and Storage watches how much database storage is in use. Slow-query monitoring requires MongoDB profiling to be enabled. Without it, Slow Queries reports Healthy.
For the full list of checks in each branch, see Health Checks Reference.
How Status Is Calculated
Cluster Health reports the most severe status from the three branches (Server, Search Cluster, and MongoDB). If every branch is healthy, cluster health is healthy. If any branch reports a warning, cluster health shows a warning, and if any branch is critical, cluster health is critical, even if the other branches are healthy.
Health checks run on a periodic schedule rather than continuously in real time. Usage-based checks, such as disk, memory, buffer, and CPU checks, are averaged over a rolling 10-minute window, so a brief spike doesn't flip the status. State-based checks, such as connectivity and processing state, change status only after the condition holds for roughly 30 seconds, to avoid flapping.
Use the Health Module
For every check in an unhealthy state, the Health Module explains the cause and provides a recommended action that takes you directly to the relevant part of the interface to resolve the issue.
Investigate a Check
To find and investigate a check that's reporting Warning or Critical:
-
Navigate to System > Overview > Health.
-
Check the status of each branch (Server, Search Cluster, or MongoDB). Healthy means all monitored components in that branch are healthy. Warning or Critical means at least one check needs attention.
-
Expand the branch showing a Warning or Critical status, and then its subsystems, until you reach the specific check causing the problem, for example Search Cluster > Server > State. MongoDB checks sit directly under the branch.
-
Select the check you want to investigate.
-
Review the What this means and Latest message sections to understand the cause of the check's status and which items are affected.
-
Follow the Recommended action to go directly to the part of the interface where you can resolve the issue.
You can also see overall cluster health at a glance from the health status badge on the left pane.
Show Only Problems
In a large cluster, you can hide healthy checks and view only the checks that have issues. On the System > Overview > Health page, click the Problems-only button at the top-right corner of the page to apply the filter.
The health tree now shows only checks currently reporting Warning or Critical, making it easier to focus on what needs attention without scrolling through a long list of healthy checks.
Further Reading
Explore the following resource to expand your knowledge on related topics: