Operational Metrics
Graylog continuously collects a wide range of operational metrics, storing them in memory on each node. These metrics include event counts, timers, and performance statistics for various components and subsystems within Graylog. By providing real-time insights into system behavior, metrics help you monitor performance, diagnose issues, and plan capacity.
Standard metrics are available via the Graylog web interface and can also be queried through the Graylog REST API Browser.
Prerequisites
Before proceeding, ensure that the following prerequisites are met:
-
You must be a Graylog administrator to enable and modify metric exporting settings.
View Standard Metrics
Graylog continuously gathers operational metrics during its runtime. These metrics provide insights into the performance and behavior of various components. You can access these standard metrics directly from the Graylog web interface by navigating to System > Nodes and clicking the Metrics button. Additionally, you can query these metrics through the REST API for deeper analysis.
Export via Prometheus Metric Exporting
Metrics can be exported to other systems via the
Prometheus Metrics Exporting feature. This feature can be optionally enabled. When enabled, Graylog will export
metrics via a standard Prometheus https
exporter on port 9833. Prometheus can then scrape and ingest the metrics.
Enable Prometheus Exporting
server.conf). For information on accessing and updating this file, see Configuration Settings.
To begin exporting Prometheus metrics:
-
Enable exporting by setting the following configuration property in the
server.conffile totrue:Copyprometheus_exporter_enabled = true -
Once enabled, metrics are exported in the standard export format on the following URI by default:
Copyhttp://127.0.0.1:9833/api/metrics/prometheusTo specify a custom export hostname or IP address, the following configuration can be used. We suggest leaving the default export port since it is already registered with Prometheus:
Copyprometheus_exporter_bind_address = 10.0.0.1:9090 -
Depending on the Prometheus scrape_config setting, an explicit scrape target might need to be specified in your Prometheus target hosts configuration.
Default Core Metric Mappings
A pre-defined core set of Graylog-to-Prometheus metric mappings are enabled by default.
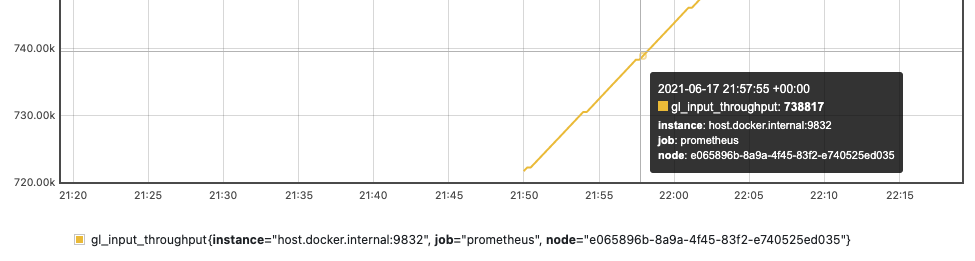
All metric names are
prefixed with gl_... to indicate that the metrics originated from
Graylog. For example, the metric named
gl_input_throughput.
All metrics are automatically assigned a
node metric label,
which contains the Graylog node ID from where the metric originated. This can be useful for visualizing the same
metric across Graylog
nodes.
Many metrics are exported with a consolidated name, which allows breakouts by labels to allow easier visualization of metrics. See the pre-defined metric mappings for a full list of metric mappings.
Customized Metric Mappings
Metric mapping requirements can vary by environment. Graylog allows you to override the default core mappings or add custom mappings to meet your specific needs.
Graylog metrics exports heavily utilize Prometheus labels to help you effectively visualize and analyze your metrics data.
Replace Default Core Mappings
To completely replace the default core mappings, specify the path to your custom core mapping YAML file. This file is monitored for changes at runtime:
prometheus_exporter_mapping_file_path_core = prometheus-exporter-mapping-core.yml
Add Additional Custom Mappings
To supplement the core mappings with additional custom mappings, provide the path to your custom mapping file:
prometheus_exporter_mapping_file_path_custom = prometheus-exporter-mapping-custom.yml
Custom Mapping for Stream Incoming Messages Example
This example mapping produces the gl_stream_incoming_messages
metric in Prometheus, which shows the number of messages received by for each stream in Graylog:
metric_mappings:
  -
    match_pattern: org.graylog2.plugin.streams.Stream.*.incomingMessages
    metric_name: stream_incoming_messages
    wildcard_extract_labels:
      - stream
The standard
metric name in Graylog contains the ID of the stream, and one distinct metric is recorded for each stream. The mapping definition that follows provides a match_pattern with a wildcard
* for the stream-id, which provides one label for
each stream id automatically. This allows for the visualization of messages received for all streams together, but
broken-out by stream-id via the labels functionality. The wildcard_extract_labels is
an ordered array, which provides the label names for any specified wildcards in the match_pattern.
Consolidated Buffer Usage Mapping Example
This example consolidates separate Graylog buffer metrics into a single Prometheus metric with distinct labels:
metric_mappings:
  - metric_name: buffer_usage
    match_pattern: org.graylog2.buffers.input.usage
    additional_labels:
      type: input
  - metric_name: buffer_usage
    match_pattern: org.graylog2.buffers.output.usage
    additional_labels:
      type: output
  - metric_name: buffer_usage
    match_pattern: org.graylog2.buffers.process.usage
    additional_labels:
      type: process
This example mapping produces the
gl_buffer_usageinput, process, and
output buffers.
Note that three separate mappings are provided to
consolidate three independent buffer Graylog metrics into a single Prometheus metric with three unique labels
(input, process,
output) that correspond to each Graylog metric.
The additional_labels
property allows for the assignment of an explicit label corresponding to the metric defined in the
match_pattern.
Custom Mappings Refresh Interval
By default, Graylog re-reads the core and custom mapping files every 30 seconds. To adjust this refresh interval, update the following configuration property with your desired duration (using standard Graylog duration notation, e.g. 5m for 5 minutes):
prometheus_exporter_mapping_file_refresh_interval = 5m
Further Reading
Explore the following additional resources and recommended readings to expand your knowledge on related topics: