pfSense and OPNsense are free, open-source firewalls and router software based on FreeBSD. They provide advanced networking features and can be used in a variety of network configurations.
This technology pack will process pfSense and OPNsense messages.
Requirement(s)
-
Supported versions include Sense CE edition 2.6 and OPNsense 23.1
-
Graylog server with a valid Enterprise license running Graylog 5.0.3+
Supported Logs
-
dhcpd(DHCP logs) -
filterlog(Firewall logs) -
nginx/lighttpd(Traffic logs) -
unbound(DNS logs, query) -
sshd(Login/Logout via SSH) -
GUI login(Login) -
sshguard(SSHGuard logs) -
audit/php-fpm(Authentication) -
php-fpm(User creation and deletion)
Beta support:
-
ntpd(NTP logs) -
kea-dhcp4(Kea DHCP logs) -
openvpn(OpenVPN logs) -
radvd(Routing advertisement logs) -
suricata(Intrusion Detection) -
snort(Snort 2.9, Intrusion Detection) -
/usr/sbin/cron(Cron System logs) -
dpinger(Gateway logs) -
charon(IPSec) -
dnsmasq(DNSMasq) -
pkg_static(Packet Manager) -
shutdown(Shutdown command) -
rc.gateway_alarm(Gateway alarm) -
snmpd(SNMP) -
arpwatch(Arpwatch) -
squid(Proxy Server, requires a specific input) -
Bind(Alternative DNS Server) -
tailscaled(Tailscale successful connection)
Stream Configuration
This technology pack includes one stream:
-
“Illuminate:pfsense_firewall Messages”
Index Set Configuration
This technology pack includes one index set definition:
-
“pfsense_firewall Logs”
Log Format Examples
dhcpd (DHCP logs)
DHCPREQUEST for 192.168.1.50 from 52:54:00:06:aa:11 (tsterkal) via vtnet1filterlog (Firewall logs)
71,,,1eb94a38e58994641aff378c21d5984f,vtnet0,match,block,in,4,0x0,,255,43376,0,DF,17,udp,73,192.168.122.40,224.0.0.251,5353,5353,53nginx / lighttpd (Traffic logs)
192.168.1.50 192.168.1.10 - [23/Mar/2023:14:48:28 +0000] "GET /api/core/system/status HTTP/2.0" 200 317 "https://192.168.1.10/services_dhcp.php?if=lan" "Mozilla/5.0 (X11; Linux x86_64; rv:102.0) Gecko/20100101 Firefox/102.0"unbound (DNS logs)
[61142:0] info: reply from <cnn.com.> 205.251.192.47#53[98871:0] query: 192.168.1.100 safebrowsing.googleapis.com. A INsshguard (SSHGuard logs)
Attack from "192.168.7.1" on service 100 with danger 10.sshd (Login/Logout via SSH)
Accepted keyboard-interactive/pam for admin from 192.168.1.100 port 53214 ssh2audit / php-fpm (Authentication)
/index.php: Successful login for user 'root' from: 192.168.1.50login (Login to a shell)
login on ttyv0 as rootLogs in Beta Support
ntpd (NTP logs)
65.182.224.60 local addr 192.168.122.34 -> <null>kea-dhcp4 (Kea DHCP logs)
INFO [kea-dhcp4.leases.0x317efda18900] DHCP4_LEASE_ADVERT [hwtype=1 c4:bd:e5:1b:94:fa], cid=[01:c4:bd:e5:1b:94:fa], tid=0x3bfb1946 lease 192.168.6.173 will be advertisedopenvpn (OpenVPN logs)
myusercert/192.168.1.100:35609 SENT CONTROL [myusercert]: 'PUSH_REPLY,redirect-gateway def1,route-gateway 192.168.2.1,topology subnet,ping 10,ping-restart 60,ifconfig 192.168.2.2 255.255.255.0,peer-id 0,cipher AES-256-GCM' (status=1)radvd (Routing advertisement logs)
ignoring RA from fe80::abcd:1234:5678:aaaa on igb0: not enough addresses for subnetsuricata (Intrusion Detection)
[46424]: [Drop] [1:2001219:20] ET SCAN Potential SSH Scan [Classification: Attempted Information Leak] [Priority: 2] {TCP} 118.123.10.10:1566 -> 192.168.1.25:22snort (Snort 2.9)
[119:4:1] (http_inspect) BARE BYTE UNICODE ENCODING [Classification: Not Suspicious Traffic] [Priority: 3] {TCP} 192.168.1.100:49922 -> 192.168.1.1:3128/usr/sbin/cron (Cron System logs)
(root) CMD (/usr/bin/nice -n20 /usr/local/sbin/expiretable -v -t 3600 virusprot)dpinger (Gateway logs)
dpinger[11000]: WAN_GW 198.51.100.1: Alarm latency 4807us stddev 1790us loss 21%charon (IPSec)
16[CFG] loaded 0 RADIUS server configurations-
Parsing is only for
charonprocess andpid.
dnsmasq (DNSMasq)
1 192.168.1.50/49952 query[A] cnn.com from 192.168.1.50pkg_static / pkg (Packet Manager)
opnsense upgraded: 23.1 -> 23.1.4_1shutdown (Shutdown command)
power-down by root:rc.gateway_alarm (Gateway alarm)
>>> Gateway alarm: WAN_DHCP (Addr:192.168.122.1 Alarm:0 RTT:1.241ms RTTsd:10.968ms Loss:0%)snmpd (SNMP)
disk_OS_get_disks: adding device 'cd0' to device listphp-fpm (User create and deletion)
/system_usermanager.php: Configuration Change: admin@192.168.1.100 (Local Database): Successfully deleted user: stefanarpwatch (Arpwatch)
new station 192.168.1.100 52:54:00:06:57:10kernel
vtnet0: promiscuous mode enabledsquid (Proxy Server, requires a specific input)
1680109171.634 171177 192.168.1.100 TCP_TUNNEL/200 111 CONNECT 192.169.3.4:443 - HIER_DIRECT/10.10.10.10 -php/php_pfb (Software Updates/News)
[pfBlockerNG] Starting cron process.Bind/named (Alternative DNS Server)
queries: info: client @0x802512d60 192.168.1.100#54251 (heise.de): query: heise.de IN A +E(0)K (192.168.1.1)tailscaled (Tailscale connection)
UDP{100.121.10.10:60074 > 192.168.2.10:53} 70 okRequirements
The pack allows you to select one of two different ways to route the logs into the right pack.
Option 1 (via device name):
-
The name of the pfSense/OPNsense device must start with
pfSenseorOPNsense. (Note these titles are case sensitive.)
Option 2 (via specific input):
-
A pfSense/OPNsense specific input on the Graylog server and an Illuminate lookup override can also be configured.
Graylog Server Configuration for a Specific Input
1. Create a new Syslog input and choose an unused port. (If an input already exists that only handles pfSense/OPNSense logs, use that input. If using a new or existing forwarder, create a new input as part of the forwarder setup process or use the input already associated with an existing forwarder.)
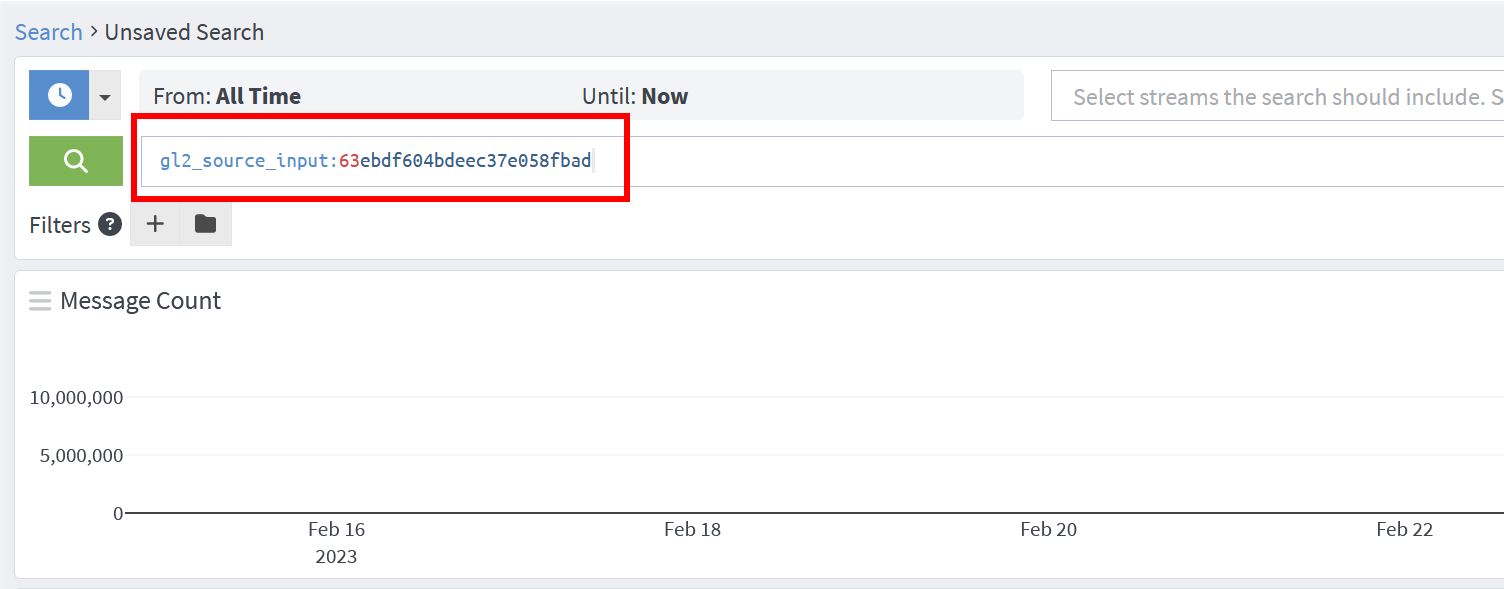
2. Once created, select Show received messages to obtain the input ID. This will pull up a search window with the "All Time" timeframe. If there is a large number of logs, you might want to adjust the timeframe to speed up the process.


3. Copy the gl2_source_input value.
4. Navigate to Enterprise > Illuminate and click on the Customization tab.
5. Locate lookup_adapter_input_routing and select Edit. For the content_name key, enter pfsense_firewall. For the input_id value, enter the gl2_source_input ID copied earlier.

6. Click Configure value to confirm.
Now, all logs sent to the configured input will be identified as pfSense/OPNSense logs and will allow for proper Illuminate processing.
pfSense/OPNsense Configuration
1. Enable remote logging on pfSense/OPNsense and configure your logging target.
2. Select the logs what you want to see. Some services require to select a setting within that service to produce logs. Most log sources are not activated by default. Some services like unbound/dns produce a high volume of logs.
3. The Hostname is the IP of your Graylog server.
4. Set a port. (Note it must match a Syslog input in Graylog.) The default protocol is udp.
5. Select or enable syslog rfc5424.
What is Provided
-
Rules to normalize and enrich pfSense and OPNSense log messages.
pfSense/OPNsense Log Message Processing
The Illuminate processing of pfSense/OPNsense log messages provides the following:
-
Field extraction, normalization, and message enrichment for pfSense/OPNsense log messages.
-
GIM categorization of the following messages:
| Event Type | GIM Category | GIM Subcategory |
|---|---|---|
| DHCPACK | dhcp | dhcp.acknowledgement |
| DHCPREQUEST | dhcp | dhcp.request |
| DHCPOFFER | dhcp | dhcp.offer |
| DHCPDISCOVER | dhcp | dhcp.discovery |
| DHCP4_INIT_REBOOT | dhcp | dhcp.default |
| DHCP4_LEASE_ADVERT | dhcp | dhcp.offer |
| DHCP4_LEASE_ALLOC | dhcp | dhcp.acknowledgement |
| ALLOC_ENGINE_V4_DISCOVER_ADDRESS_CONFLICT | dhcp | dhcp.discovery |
| EVAL_RESULT | dhcp | dhcp.default |
| network traffic | http | http communication |
| GUI login | authentication | authentication.logon |
| GUI logout | authentication | authentication.logoff |
| ssh login | authentication | authentication.logon |
| pw_admin_change | iam | iam.object modify |
| pw_user_change | iam | iam.object modify |
| login_failed | authentication | authentication.logon |
| created user | iam | iam.object modify |
| deleted user | iam | iam.object modify |
| snort alert | detection | detection.default |
| suricata alert | detection | detection.default |
| sshguard attack alert | detection | detection.default |
| ipv4 traffic | network | network.network connection |
| ipv6 traffic | network | network.network connection |
| tailscale connection | network | network.network connection |
| squid connection | network | network.default |
| ipv4 icmp traffic | network | network.default |
| ipv6 icmp traffic | network | network.default |
| ipv4 igmp traffic | network | network.default |
| snmpd connection | network | network.default |
| dns query | name resolution | name resolution.dns request |
pfSense/OPNsense Spotlight Content Pack
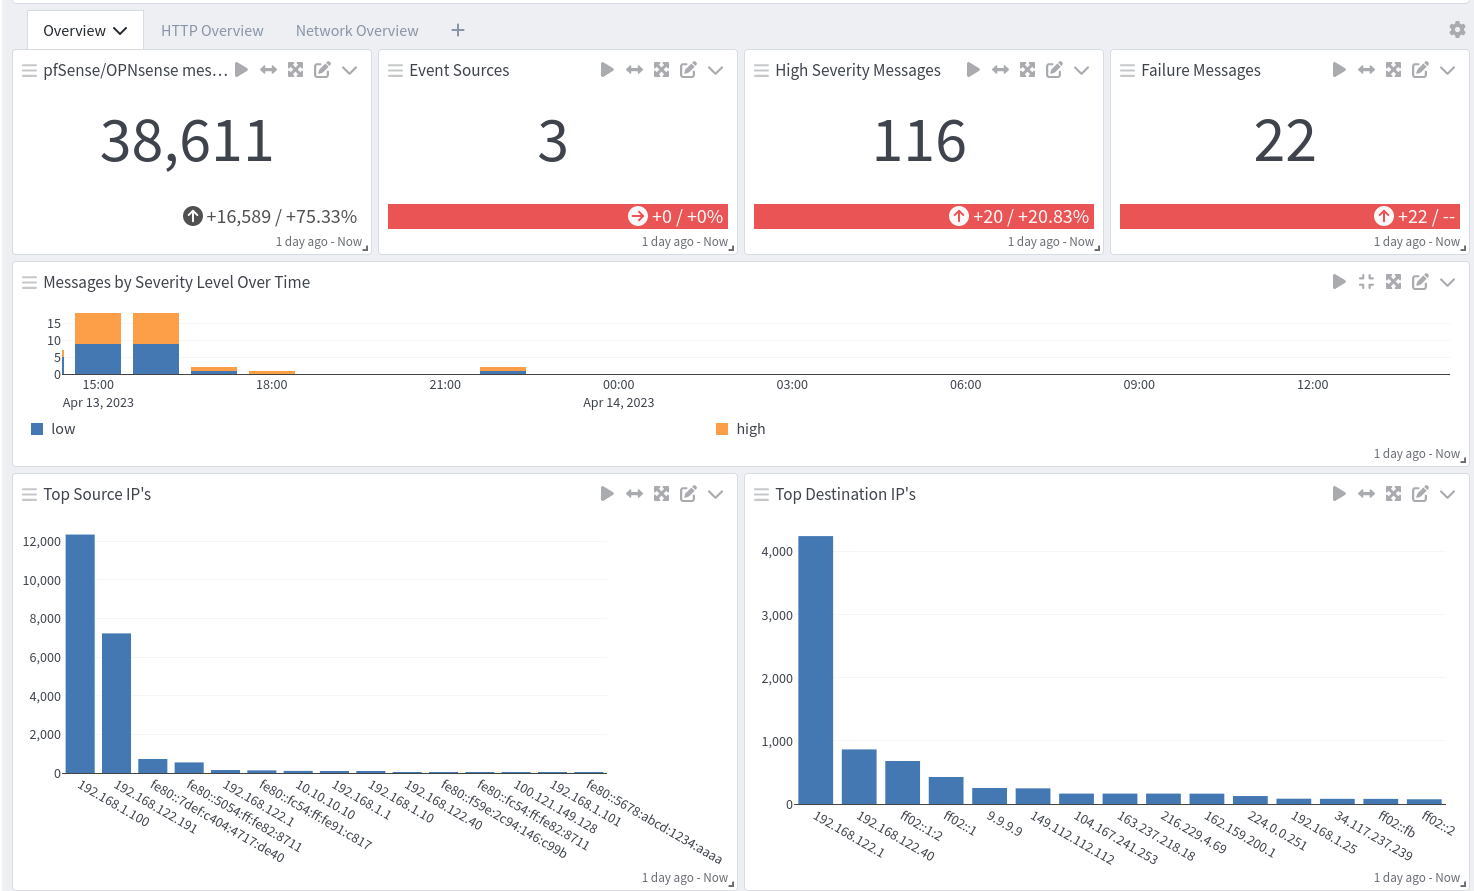
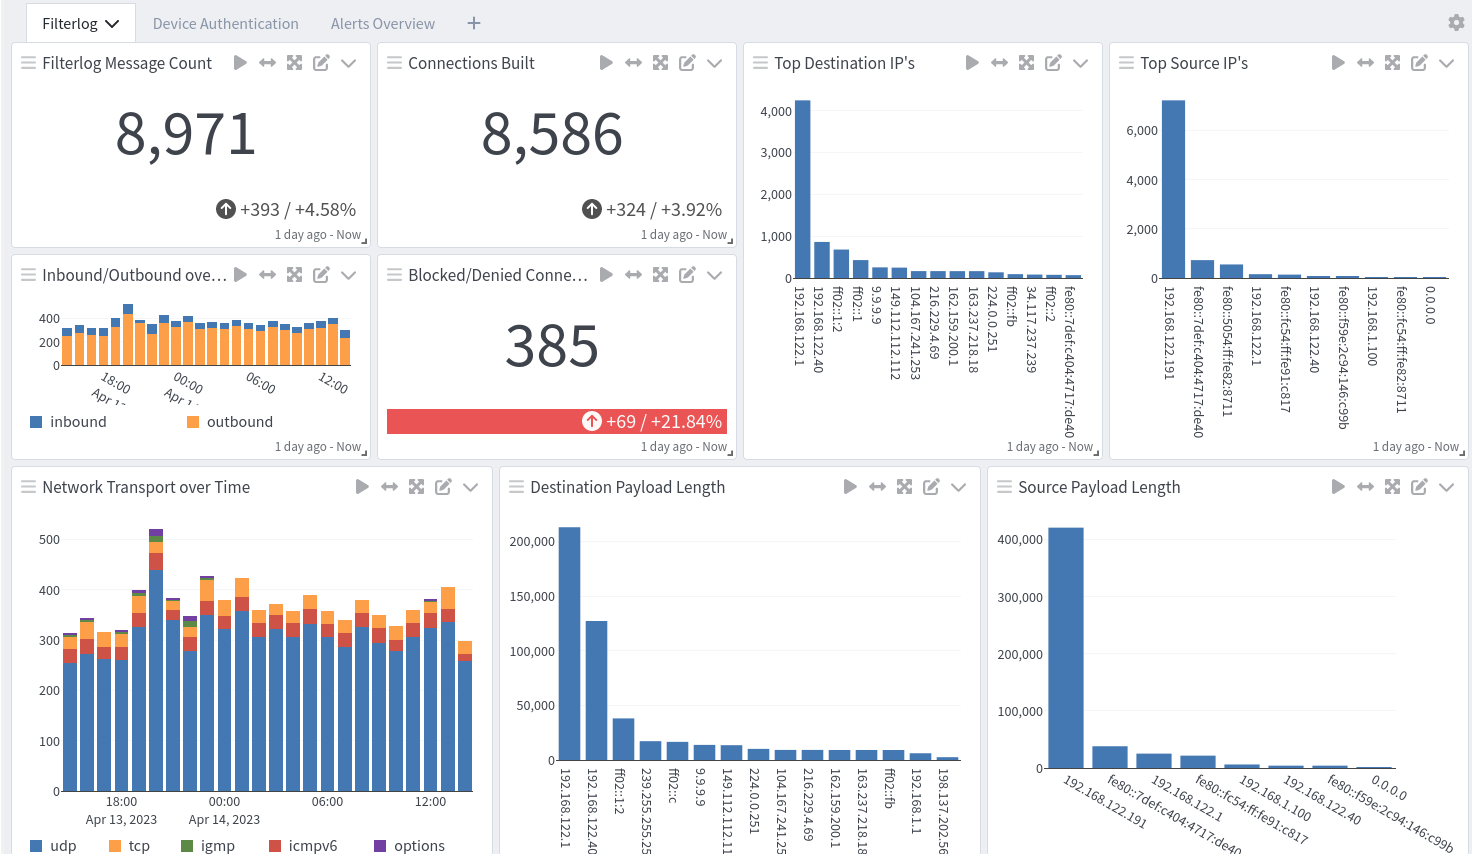
pfSense/OPNsense offers two dashboards: a dashboard with overviews and a dashboard with filterlogs and alerts.


