The API browser provides full, interactive access to the Graylog REST API through a graphical web UI. You can perform the same functions through the API that you can perform through the standard Graylog web interface.
The API browser is a good choice for actions such as:
-
Performing single requests, either to retrieve information or to make changes.
-
Learning the requirements of methods (parameters, syntax) so that you can use them in scripts.
For actions that you frequently repeat or that require multiple steps to complete, consider scripting API calls instead.
Prerequisites
Before proceeding, ensure that the following prerequisites are met:
-
The API browser is a custom Swagger UI implementation that runs in the latest versions of Google Chrome, Microsoft Edge, Firefox, and Safari.
-
You must have appropriate credentials assigned to your Graylog user profile.
Hint: When you perform calls through the API browser, the calls are authenticated via the credentials you used to log on to Graylog. Thus, performing an API call for which your user role does not have appropriate permissions results in the call failing with an associated response code.
Access the API Browser
You can access the API browser through the Graylog web interface:
-
Select the Help icon
 at the upper right.
 -
Select API browser.
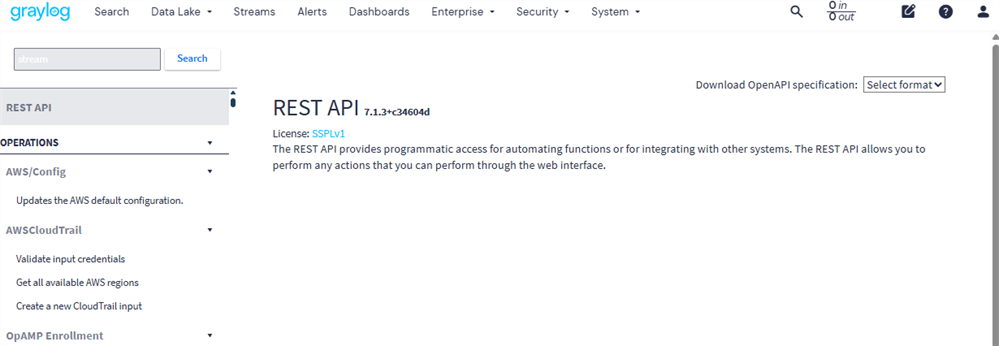
The API browser lists all the Graylog REST API endpoints and methods along the left. Find endpoints by scrolling the list or enter keywords in the search field. Select the Search button to open Advanced Search, which allows you to toggle additional search options, such as searching within request parameters or response descriptions.
Note that you can also download the entire API specification, either as JSON or YAML, which can be useful to integrate with other tools.
The Detail Pane
Select an endpoint on the left to view the interactive detail pane in the main window.
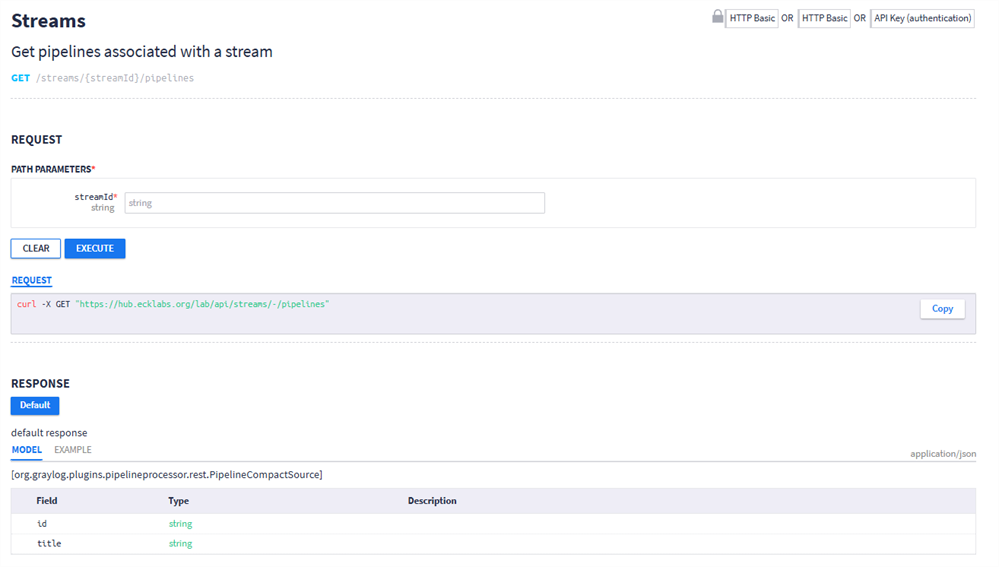
The endpoint description appears at the top. The method type (GET, POST, etc.) along with the full path of the endpoint appears just below the description.
The method detail pane is divided into two sections, Request and Response.
The Request Section
Use the Request section to see how a command for this endpoint must be written as well as to execute the command. This section shows any parameters to include as well as whether they are required or optional. Some parameters are available as fields where you can enter a value, like streamID in the screenshot. Other parameters must be entered by updating the JSON request body, which you do in the Request Body section.
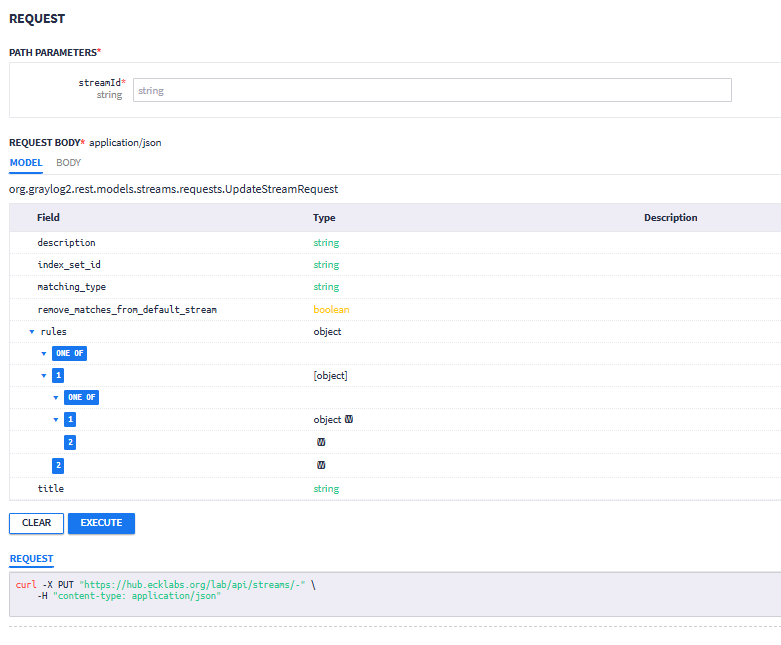
Under Request Body, the Model tab shows the full schema for the JSON. Use this information to determine what fields to customize. Use the Body tab to enter custom values in the text editor.
As you enter parameters, the Request section at the bottom updates automatically, showing what a curl command for the method should be. Note that you can copy this code to use at the command line.
Use Execute to run the command after you enter all required parameters plus any optional parameters you choose to include.
Warning: Calls via the API browser act on your Graylog environment as if performed directly through the web interface. Keep in mind that these operations can change data or status within your environment.
A Response Status and Execution Time appear beneath the Execute button after you run a command. The Response tab appears next to Request, displaying the full JSON return value for any command that returns a value. The Request Headers tab shows additional information about the command and can be useful for troubleshooting.
The Response Section
Use the Response section to determine how to read returned results. This section typically begins with a list of HTTP error codes and descriptions. These codes are common responses that might get returned when using the endpoint, although the list is not exhaustive.
The table includes two tabs. The Model tab shows all fields and objects that can be displayed in a valid response. The Type column shows the data type for each item (Boolean, string, date-time, etc.). The Description column includes additional information for some items. For instance, if the type is string enum, the description displays the list of possible options for that item.
The Example tab displays what a response looks like when properly formatted in JSON.