Log View is a widget that presents log data in a format similar to common log format and resembles a console display. The Log View widget allows you to scroll through log events as new lines populate in real-time.
The Log View widget provides a way to investigate your log events, so you can:
- Record faults to diagnose and debug.
- Identify security breaches and other system and network misuses.
- Perform audits.
The Log View widget allows you to create highly customizable reports and info graphics, add reports to your dashboards, and save and retrieve reports in the event you need to review that data. You can add new values, fields, and metrics to build reports that meet your needs.
Create a Log View Widget
The log view widget option is located on the expandable bar on the left. To create a widget:
- Click the Create (+) button to extend the menu.
- Select Log View to generate the widget in the main UI.
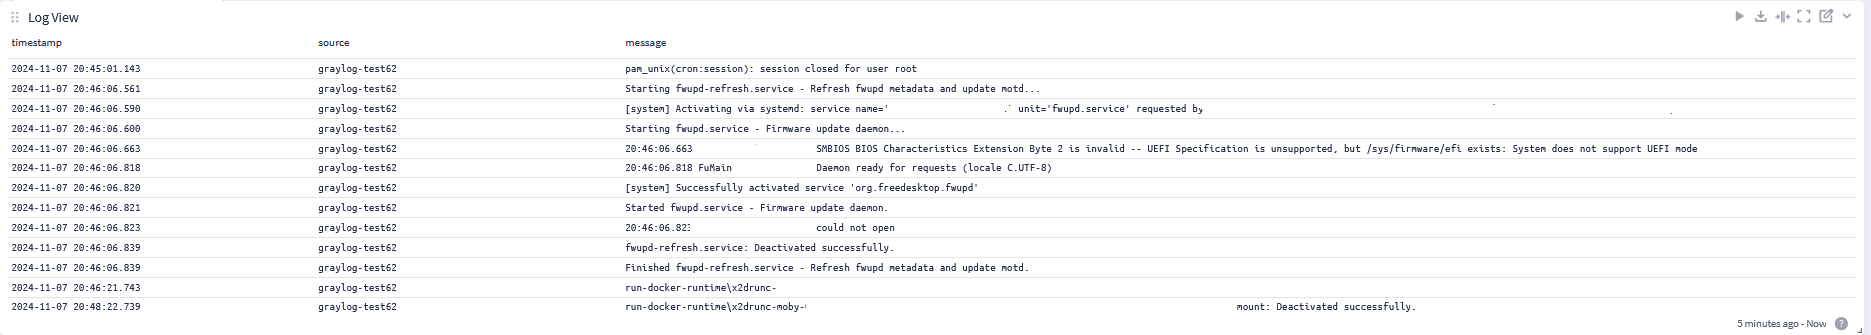
By default, the timestamp,source,message fields are presented in plain text format.
Add New Fields to the Report
You can add new fields to build more detailed reports. For example, you may need to associate activity between the website company.org and a response code.
- Click the diagonal arrow icon on the right side of a log line.
- Review and select one or more options, e.g.
https_response_code. - Click Save & Close.
Alternatively, add new fields via the configuration modal:
- Click the pen icon found inthe top right corner of the widget.
- Locate FIELD SELECTION AND ORDER and click the drop down arrow, or type in a value.
- Click Update Widget to save any edits.
Focus on the Widget
Locate the Focus this widget icon in the main log view interface. Click to expand the widget to full view.
Build a Dashboard with Shareable Data
In this section, you will determine a format that best suits your message delivery efforts, and download a report. For example, you might pass on:
- Plain text data to your peers for analysis (e.g. Log File/Plain Text ).
- Data to a logging library built in JavaScript (e.g. JSON ).
- Structured data objects to TCP or UNIX pipes (e.g. NDJSON ).
If configured, you can use the dashboard created above in the Create a Log View Widget section.
Follow these steps:
- Click the chevron icon to access the Actions menu.
- Click the downward facing arrow to access the dialogue.
- Select an output format.
- Locate the Fields to export section and add additional fields to the pre-defined options chosen in Add New Fields to the Report.
- Click the clock icon to configure an absolute date range. The format is displayed as
yyyy-MMM-dd HH:mm:ss.SSS. - Select a number under Messages limit.(optional)
- Click Start Download.