Overview
Graylog Security works in tandem with your existing Graylog environment and features expanded SIEM, security analytics, and Anomaly Detection capabilities. It provides you with a new workspace that includes pre-configured dashboards representing the most significant event and anomaly log data in a central location.
Prerequisites
-
You must obtain a Graylog Security license to activate the Security product. Contact the Graylog Sales team for more information on purchasing and downloading this license.
-
Illuminate is also required as part of your Security environment.
-
It is recommended that you upgrade to at least Graylog 4.3 to utilize Security content to the greatest effect.
Security Dashboards
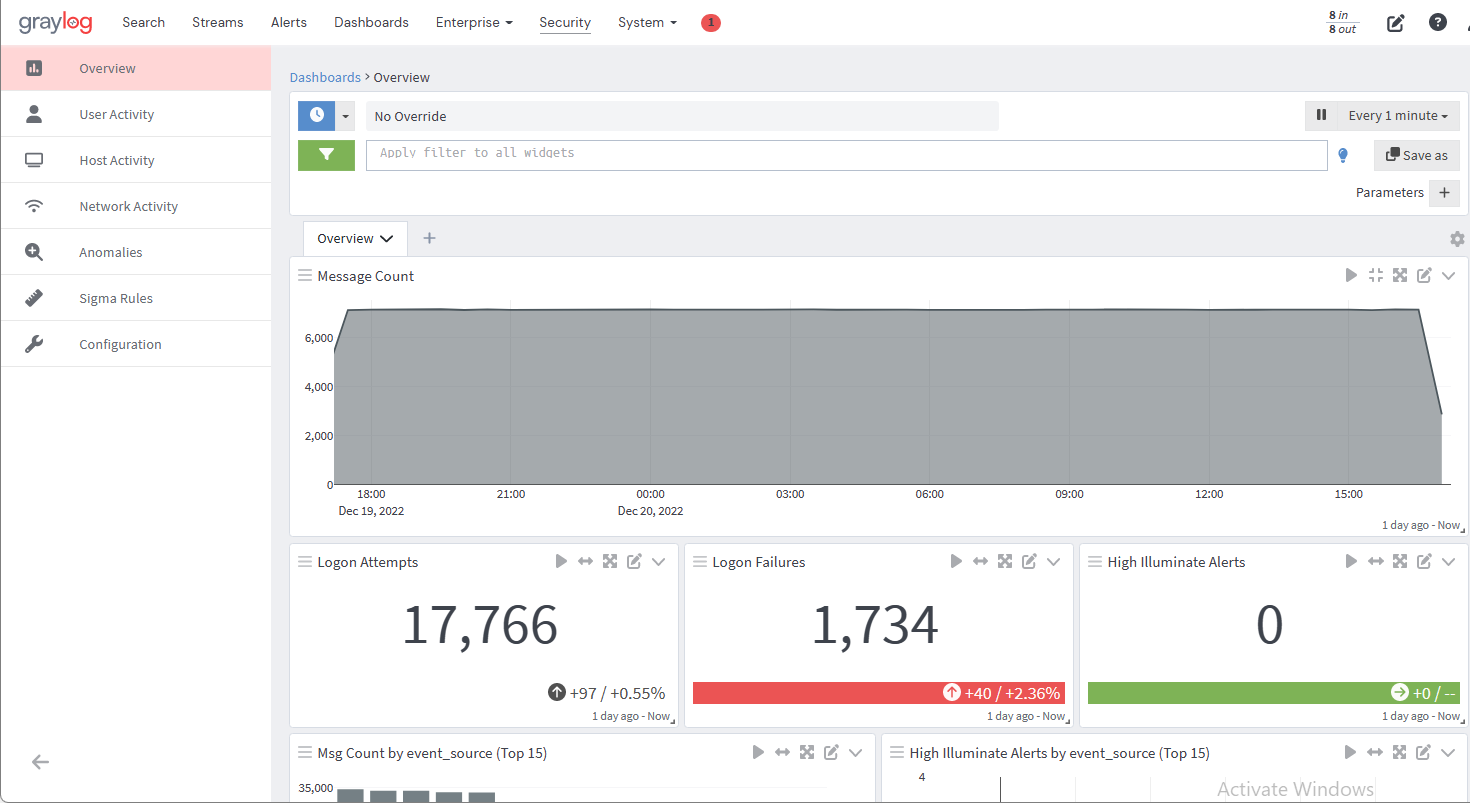
Five out-of-the-box dashboards are included in the Security tool: Overview, User Activity, Host Activity, Network Activity, and Anomalies. (The Configuration selection allows you to configure your Anomaly Detection tool, as described in the related user guide.)
- Overview: The Overview dashboard displays visual metrics concerning some of the most commonly investigated log data, including logon attempts, logon failures, message counts, etc.
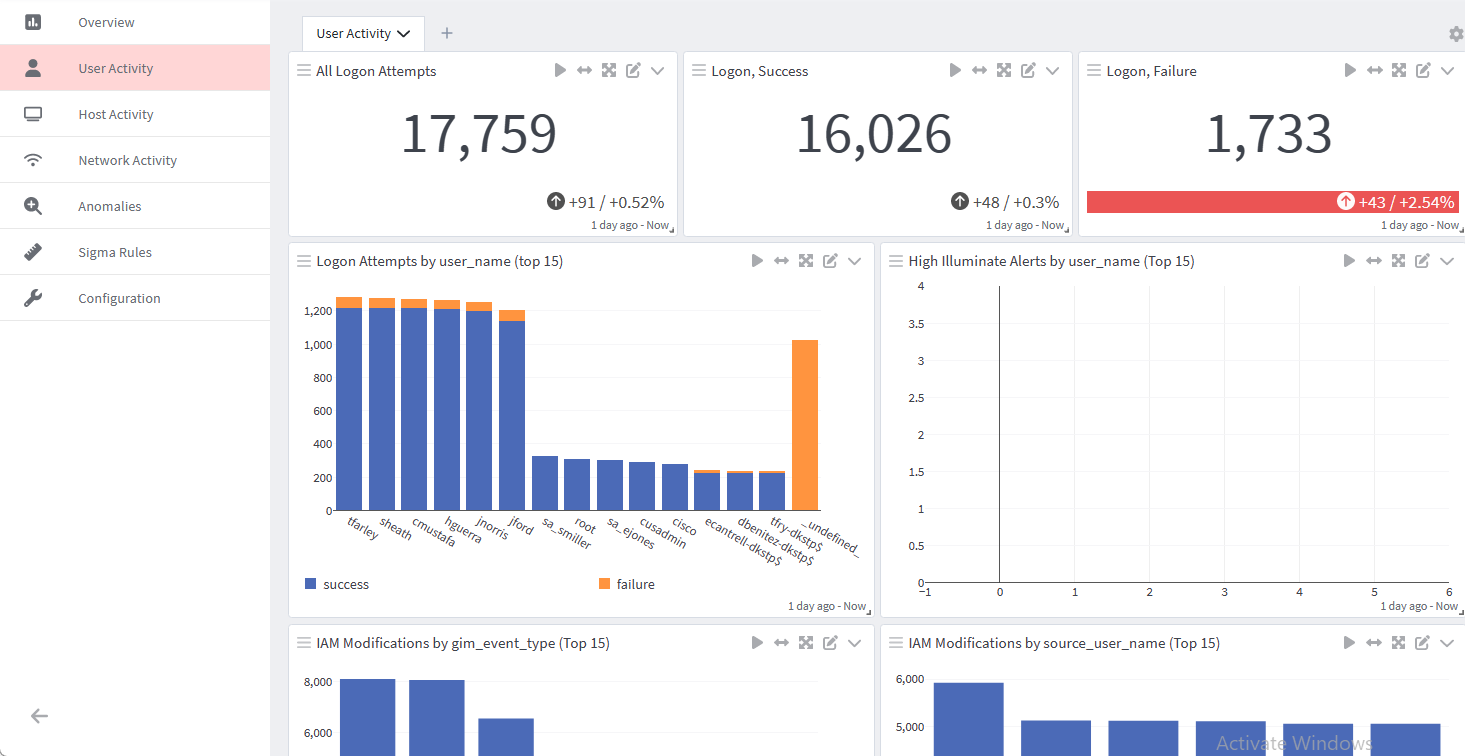
- User Activity: As the title suggests, this is a dashboard centered around user activities. With this dashboard you can search for a particular user within the logs, review their activities, and visualize their interactions across various parameters. Typical user activities like authentications, permissions, account creation, logon attempts by username, logon failures, logon successes, and more are tracked and displayed in this location.
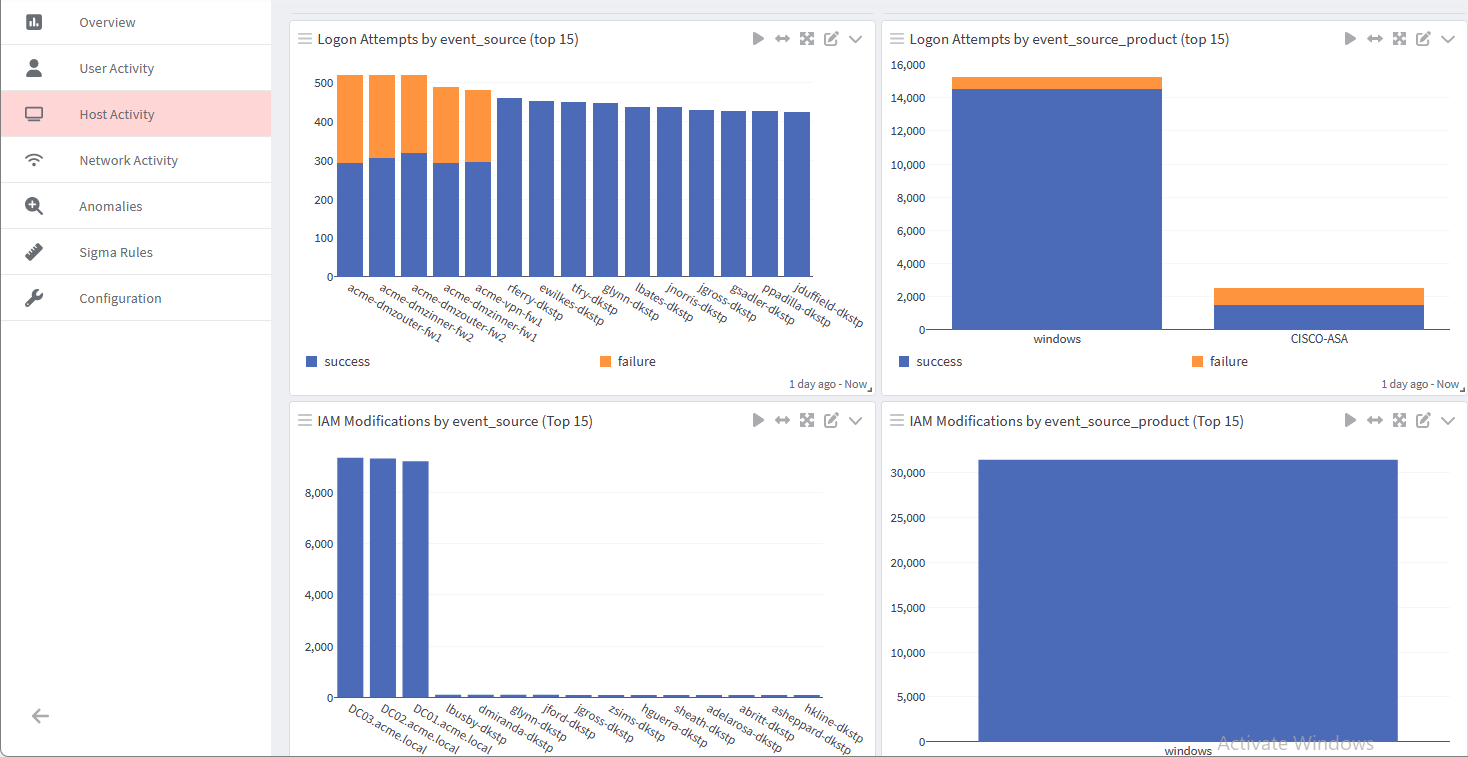
- Host Activity: Similar to User Activity, this dashboard displays log data emanating from specific hosts or devices. It supports the security analyst in investigating the source of any unusual or significant event.
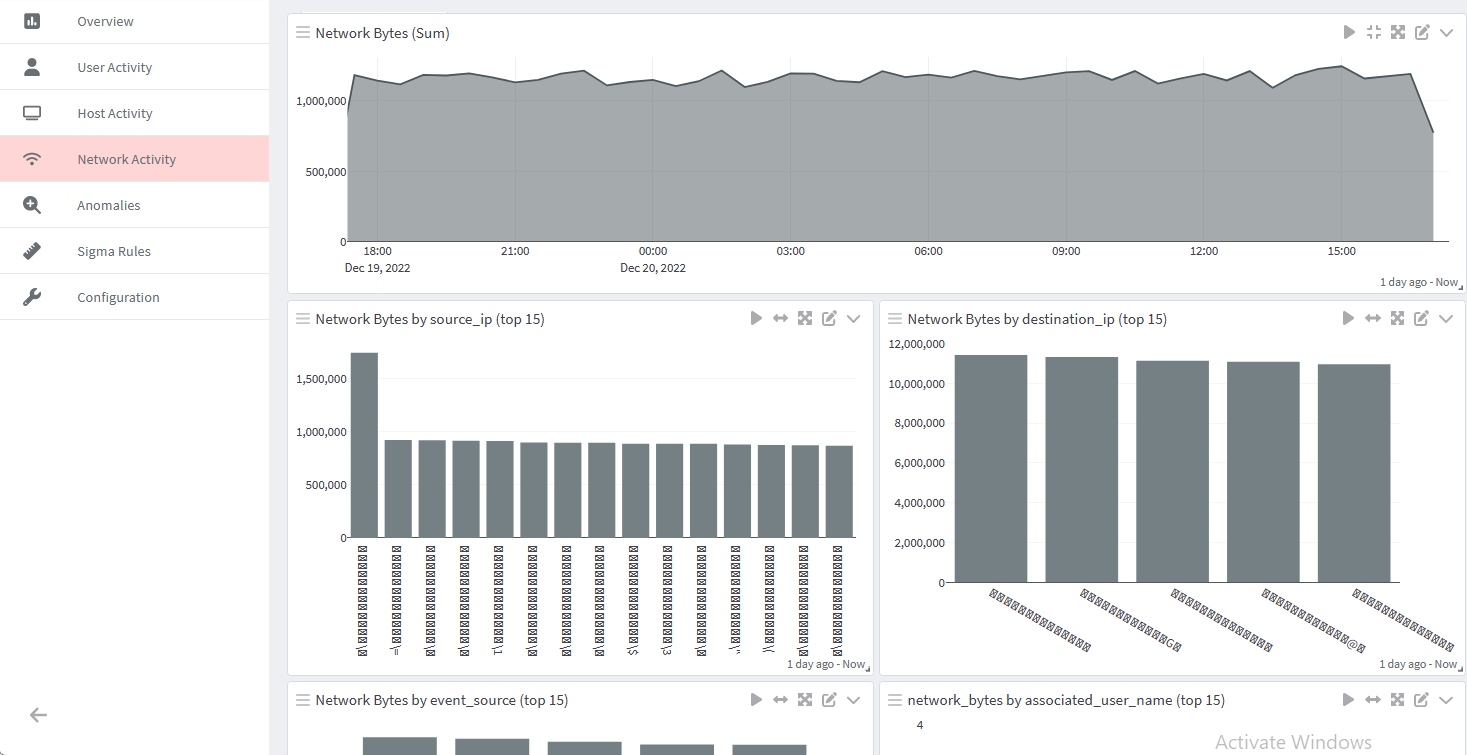
- Network Activity: The Network Activity dashboard focuses on monitoring network traffic, designating usage by source, destination, user names, IPs, etc.
- Anomalies: This dashboard provides a snapshot of any anomalous activity occurring in your environment depending on the specific detectors you have enabled. See the Anomaly Detection User Guide for a detailed look into this tool.
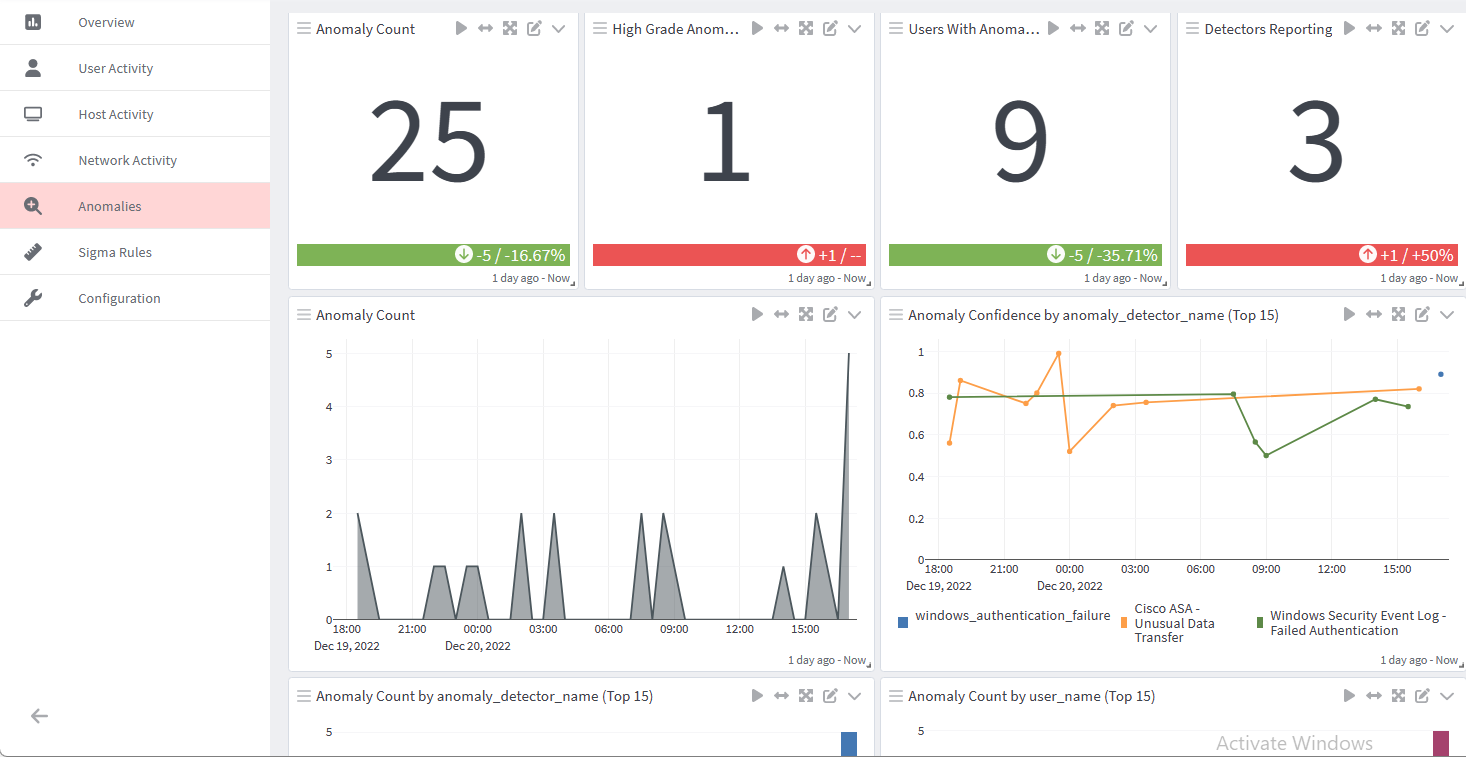
Drill Down View Use Case
With the seamless integration of Graylog tools, the Security product is enhanced by allowing you to investigate specific user profiles more closely in the drill down view.
In the following use case scenario, after noticing some unusual behavior patterns in the Anomaly Detection dashboard, we decide to investigate further data points associated with a selected user name in the drill down view.
- Click on the selected user name to open the drop down menu.
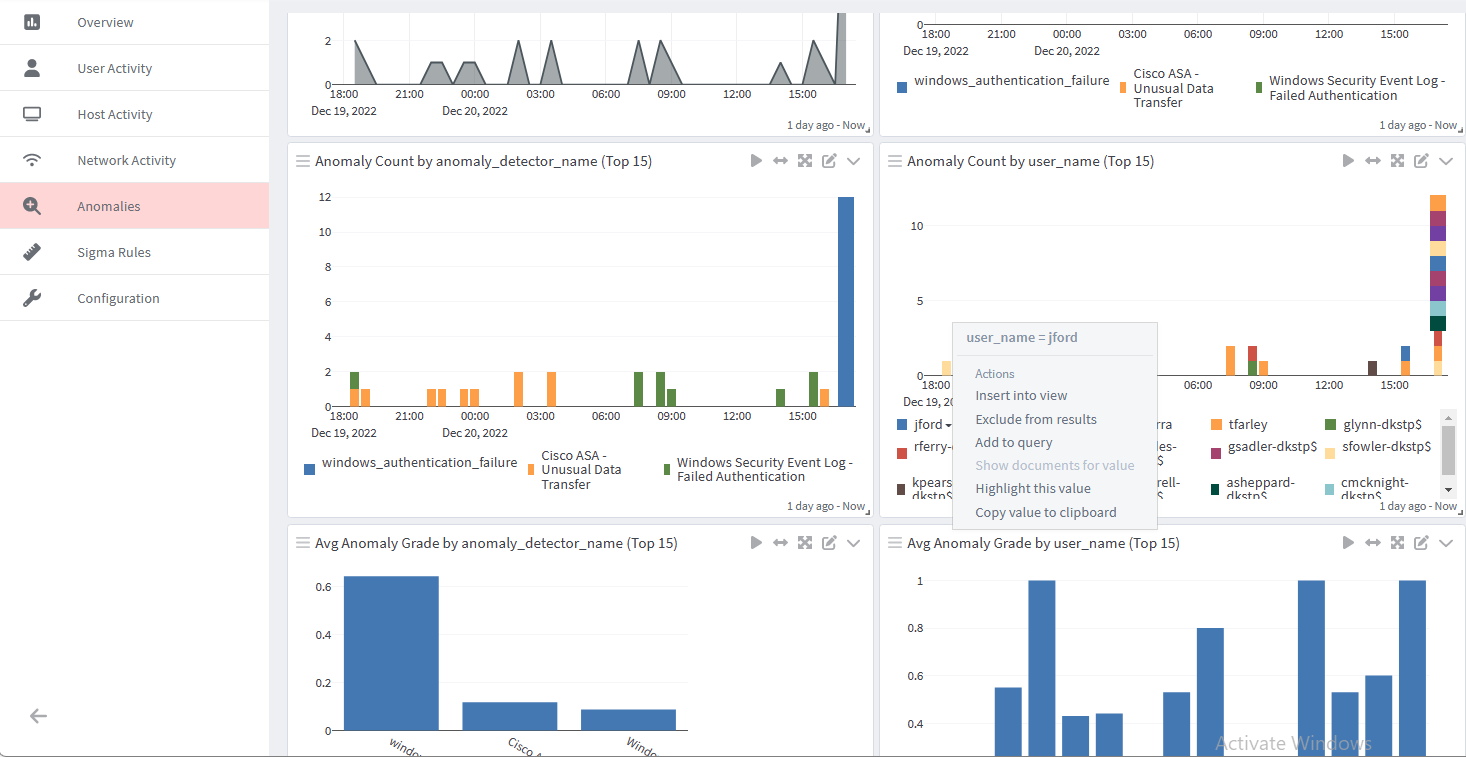
- Select the "Insert into view" option.
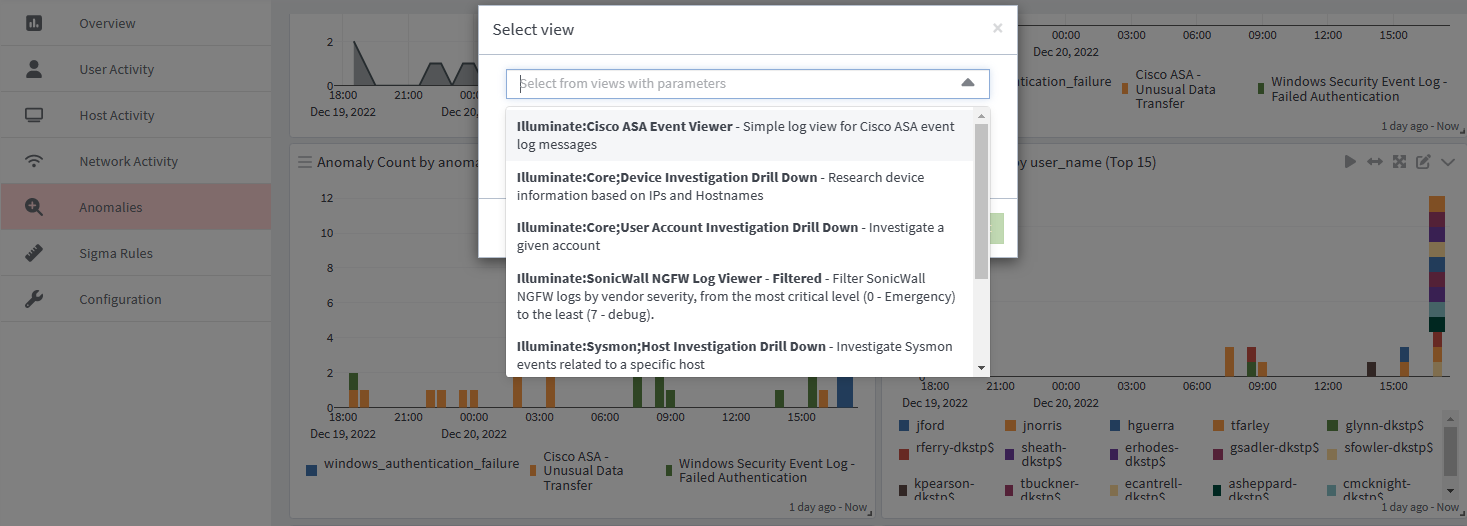
- Select a drill-down view. Users can drill down on a user based on a user account or by IPs and hostnames.
So, for this example, we see a drill-down view on the username "jford." All activities associated with this user are displayed in this drill-down view, displaying user-focused widgets such as "User Session ID," "Network Bytes," and many more.
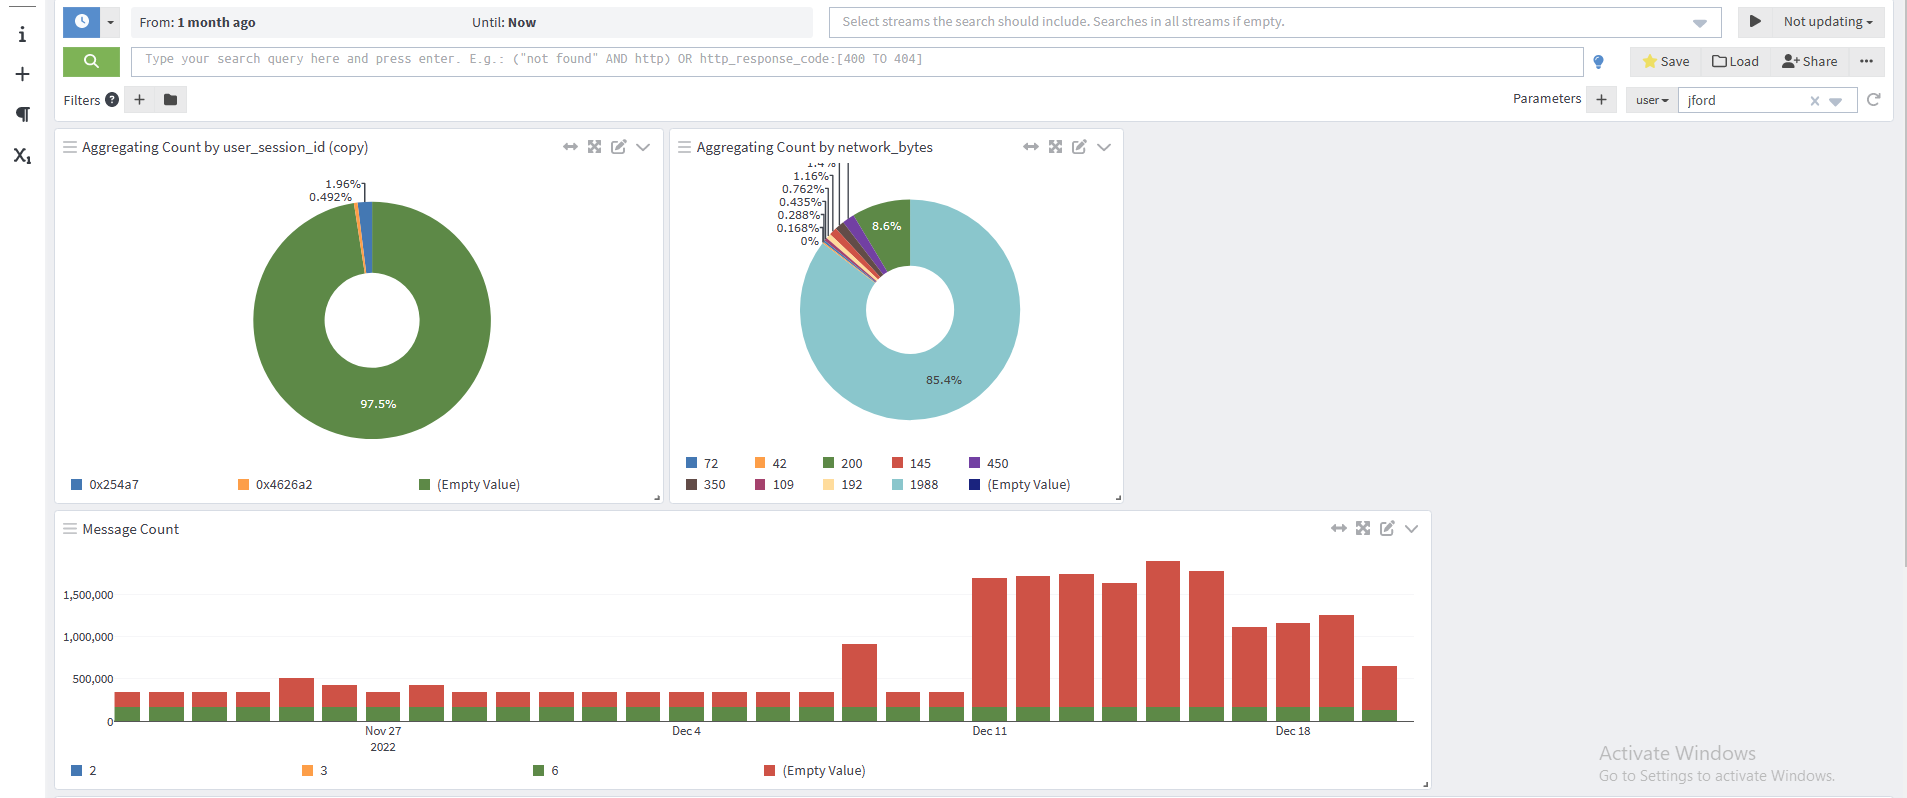
This capability allows analysts a prebuilt investigation workflow, allowing consistent outcomes no matter who is performing the investigation. It also narrows their focus on a select user's activities across the entire monitored system.